

SITCOMTN-082
Hard Point Breakaway Analysis#
This is a technote for the description of results from Individual Hardpoint Breakaway Test.
Abstract#
This technote describes the analysis and results derived from individual hardpoint breakaway tests conducted with the M1M3 surrogate. The notebook is located within notebooks_vandv GitHub repository. With all the steps guarded with reasonable timeouts, so problems are detected if hardpoint cannot travel to reach low or high limit switches, etc. If this test shows that the hardpoints do not work properly at the limits, this could be one of the blockers for the installation of M1M3 until it is solved.
Hardpoint Breakaway Test#
The active support system of the M1M3 includes six axial hardpoint actuators in a hexapod configuration. [Daruich et al., 2018]
These hardpoint actuators should minimize forces during slews at any TMA position and be kept under the breakaway limit. The breakaway limit for each hardpoint is in the range of -4420N to -3456N for retraction and 2981N to 3959N for extension. The following steps are performed during an individual hardpoint breakaway test are shown in test case LVV-T231.
As a summary:
Move hardpoint in negative (increasing tension) direction until the breakaway mechanism activates.
Move hardpoint in positive (increasing compression) direction until the breakaway mechanism activates.
Move hardpoint downwards (increasing tension) until the breakaway mechanism activates.
Move hardpoint back to its reference position.
Wait for the hardpoint to reach its reference position.
Requirements and Tickets#
Associated JIRA tickets and requirements with this test:
LTS-88 LTS-88-REQ-0017-V-01: 3.7.5.1 Load Limiting Axial Breakaway Mechanism Displacement
LVV-11200 LTS-88-REQ-0015-V-01: 3.7.1.3 Hardpoint Displacement Repeatability and Resolution_1
LVV-11184 LTS-88-REQ-0024-V-01: 3.7.1.7 Hardpoint Axial Breakaway Repeatability_1
LVV-11208 LTS-88-REQ-0025-V-01: 3.7.1.8 Hardpoint Stiffness Limits_1
List of Hardpoint Breakaway Test#
elevation |
azimuth |
Start Time |
SALIndex |
|---|---|---|---|
(deg) |
(deg) |
(YYYY-MM-DDTHH:MM:SS) |
|
0 |
-29.69 |
2023-05-30T21:26:51 |
100056 |
1 |
-29.69 |
2023-05-30T22:40:34 |
100057 |
5 |
-29.69 |
2023-05-31T00:00:10 |
100058 |
10 |
-29.69 |
2023-05-31T01:03:26 |
100059 |
20 |
153 |
2023-05-27T02:49:55 |
100036 |
20 |
153 |
2023-05-30T08:26:34 |
100047 |
40 |
153 |
2023-05-26T02:23:28 |
100034 |
89.95 |
153 |
2023-06-20T03:11:00 |
100038 |
90 |
-29.69 |
2023-05-31T05:44:14 |
100061 |
Hardpoint Test Result#
A general results of HP Test#
Note
General results from HP test
More detailed description for results from HP tests.
HP Test at EL = 90deg#
These are results from hardpoint breakaway tests when the TMA is positioned at EL=90 deg, AZ=-29.69 deg. Figure 1 shows that measured forces on the hardpoint 1 - 6 during the hardpoint axial breakaway test. Measured forces on all hardpoints look working properly because breakaway happened in the range of the requirement (tension: -4420 - -3456N, compression: 2981 - 3959N).
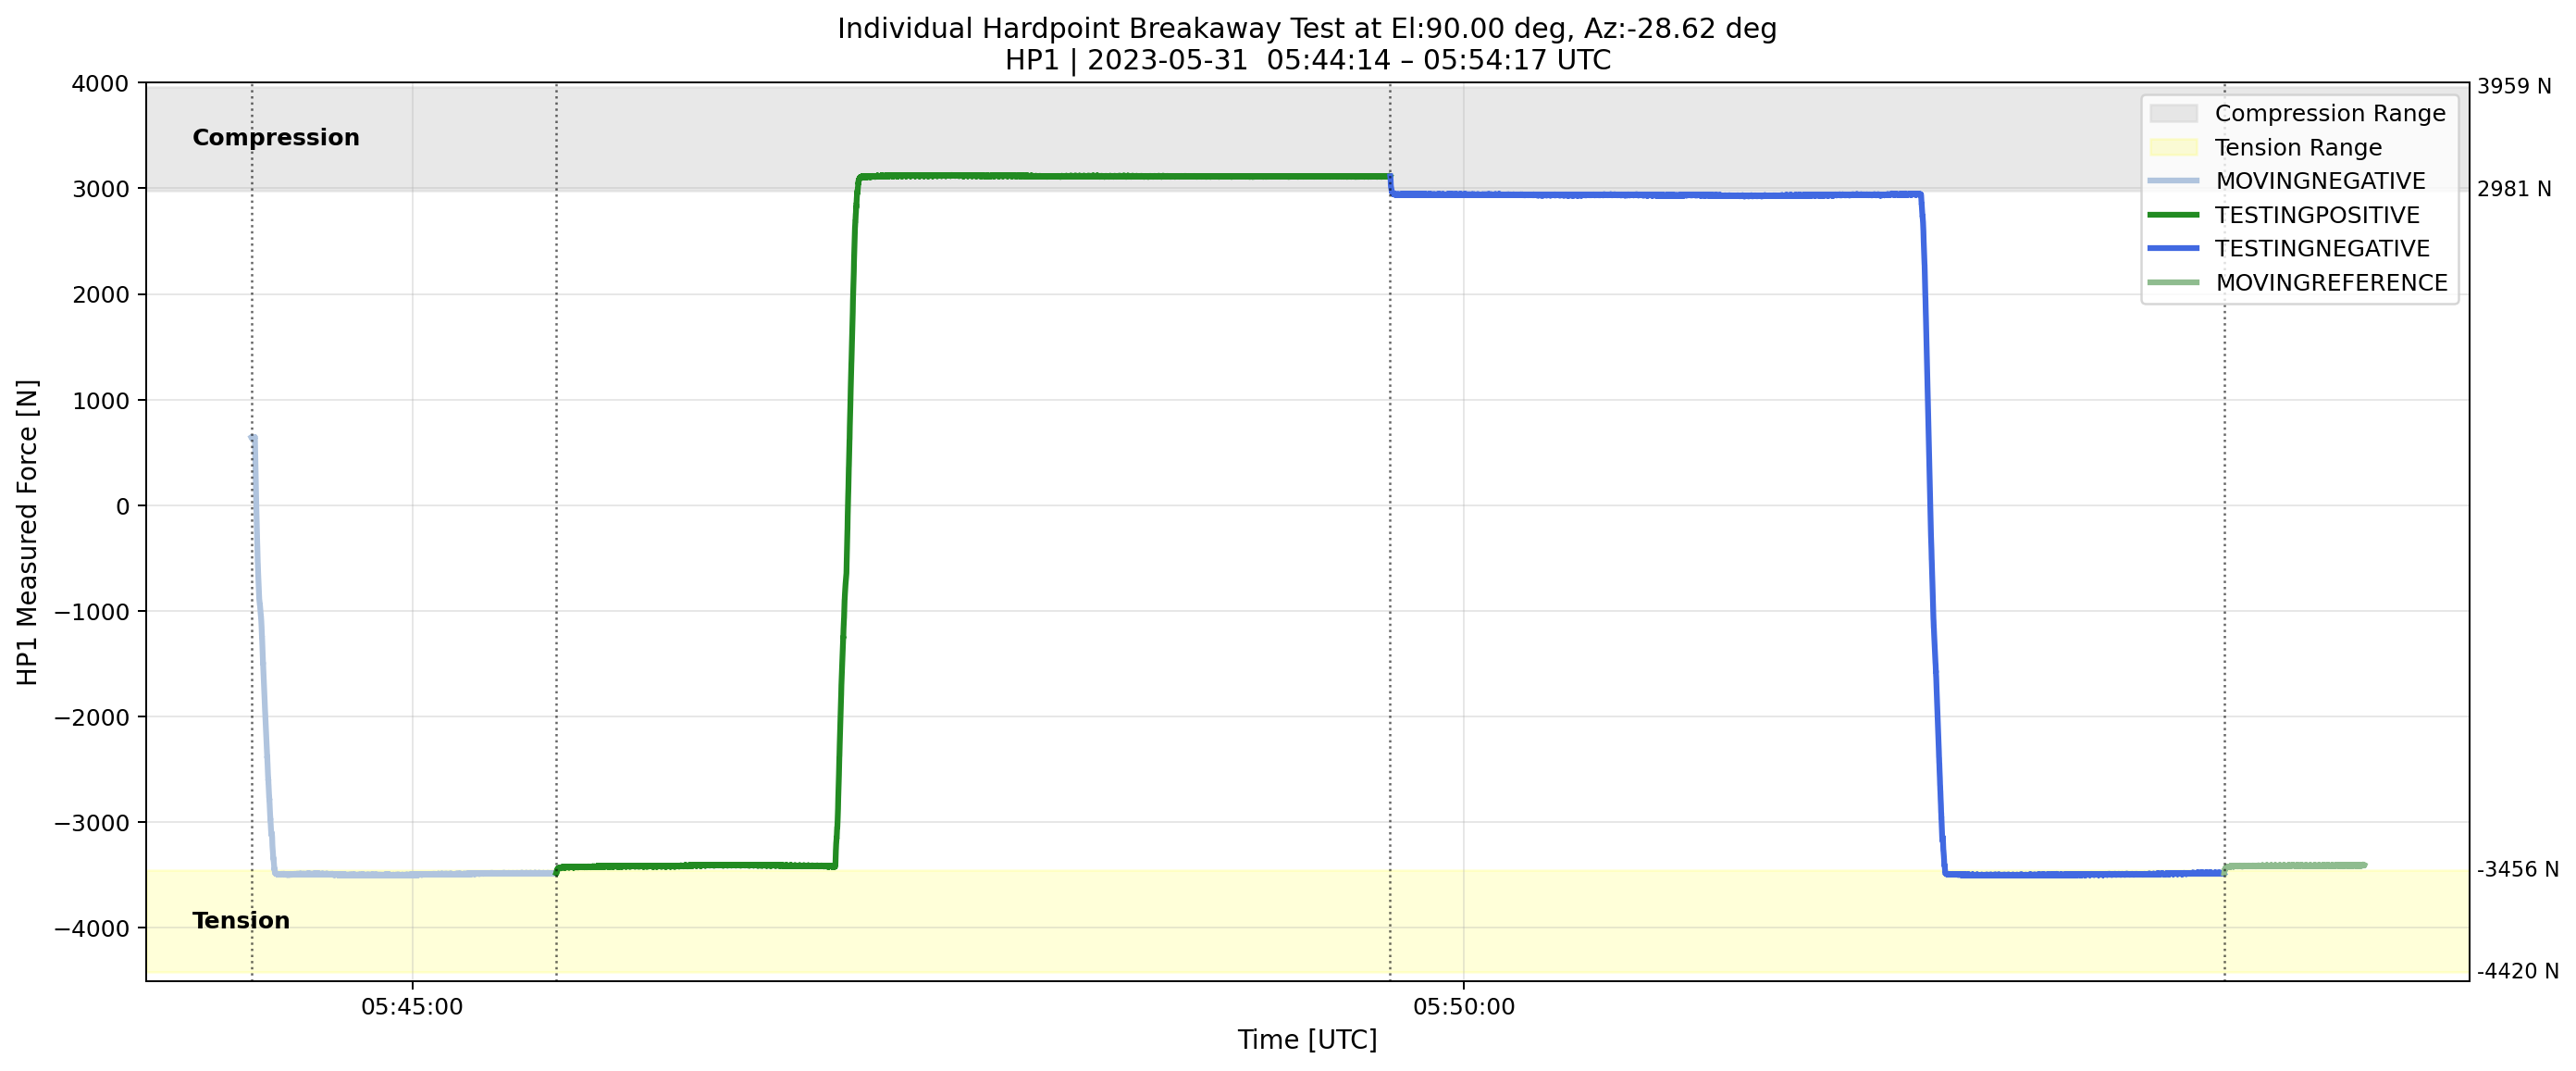
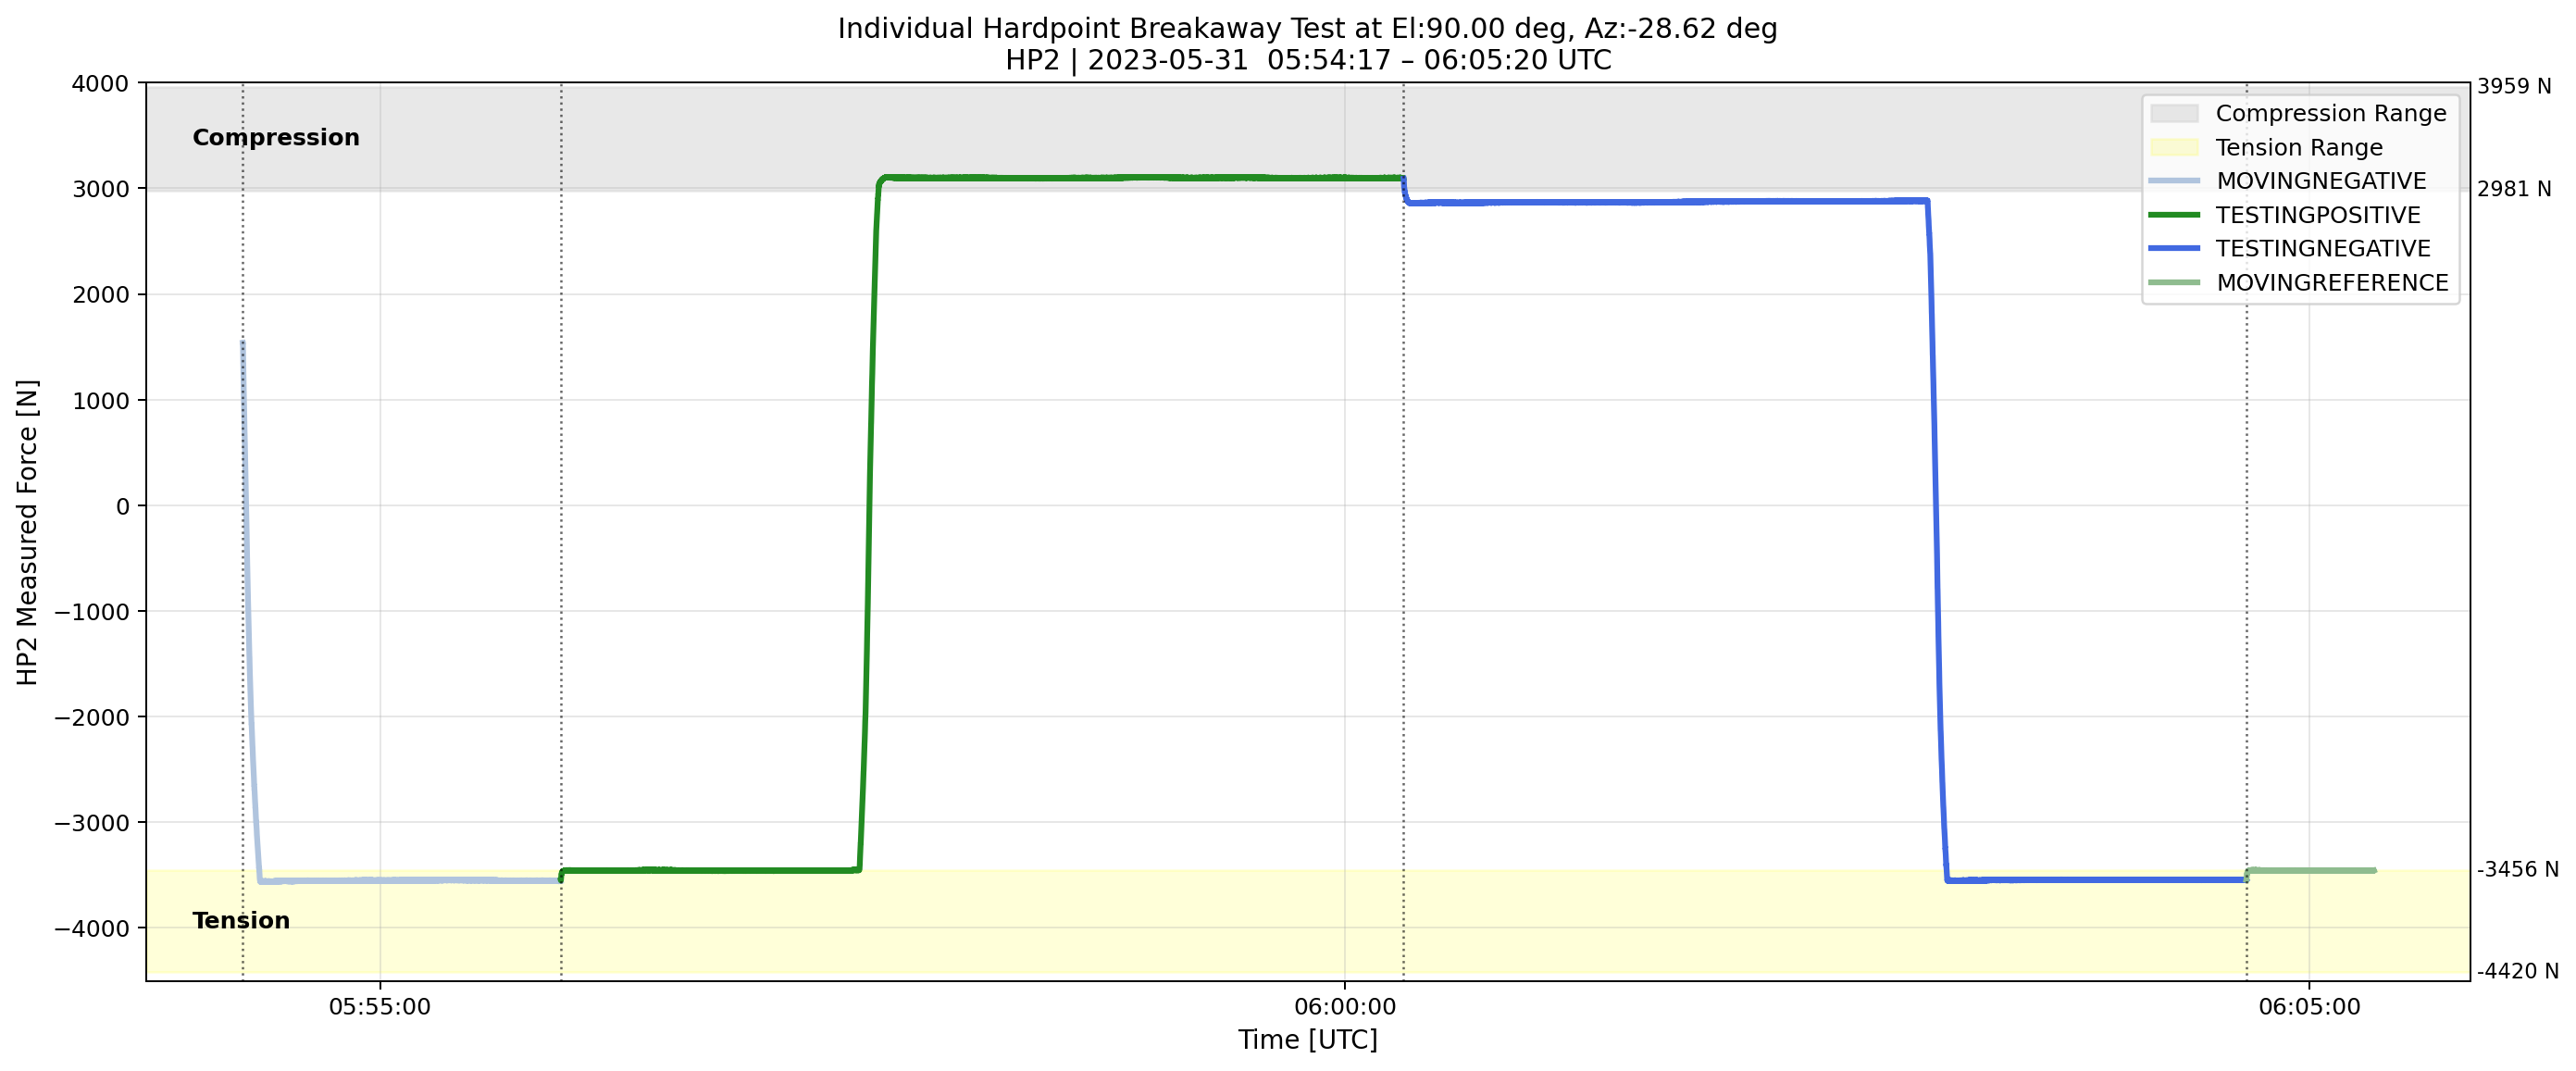
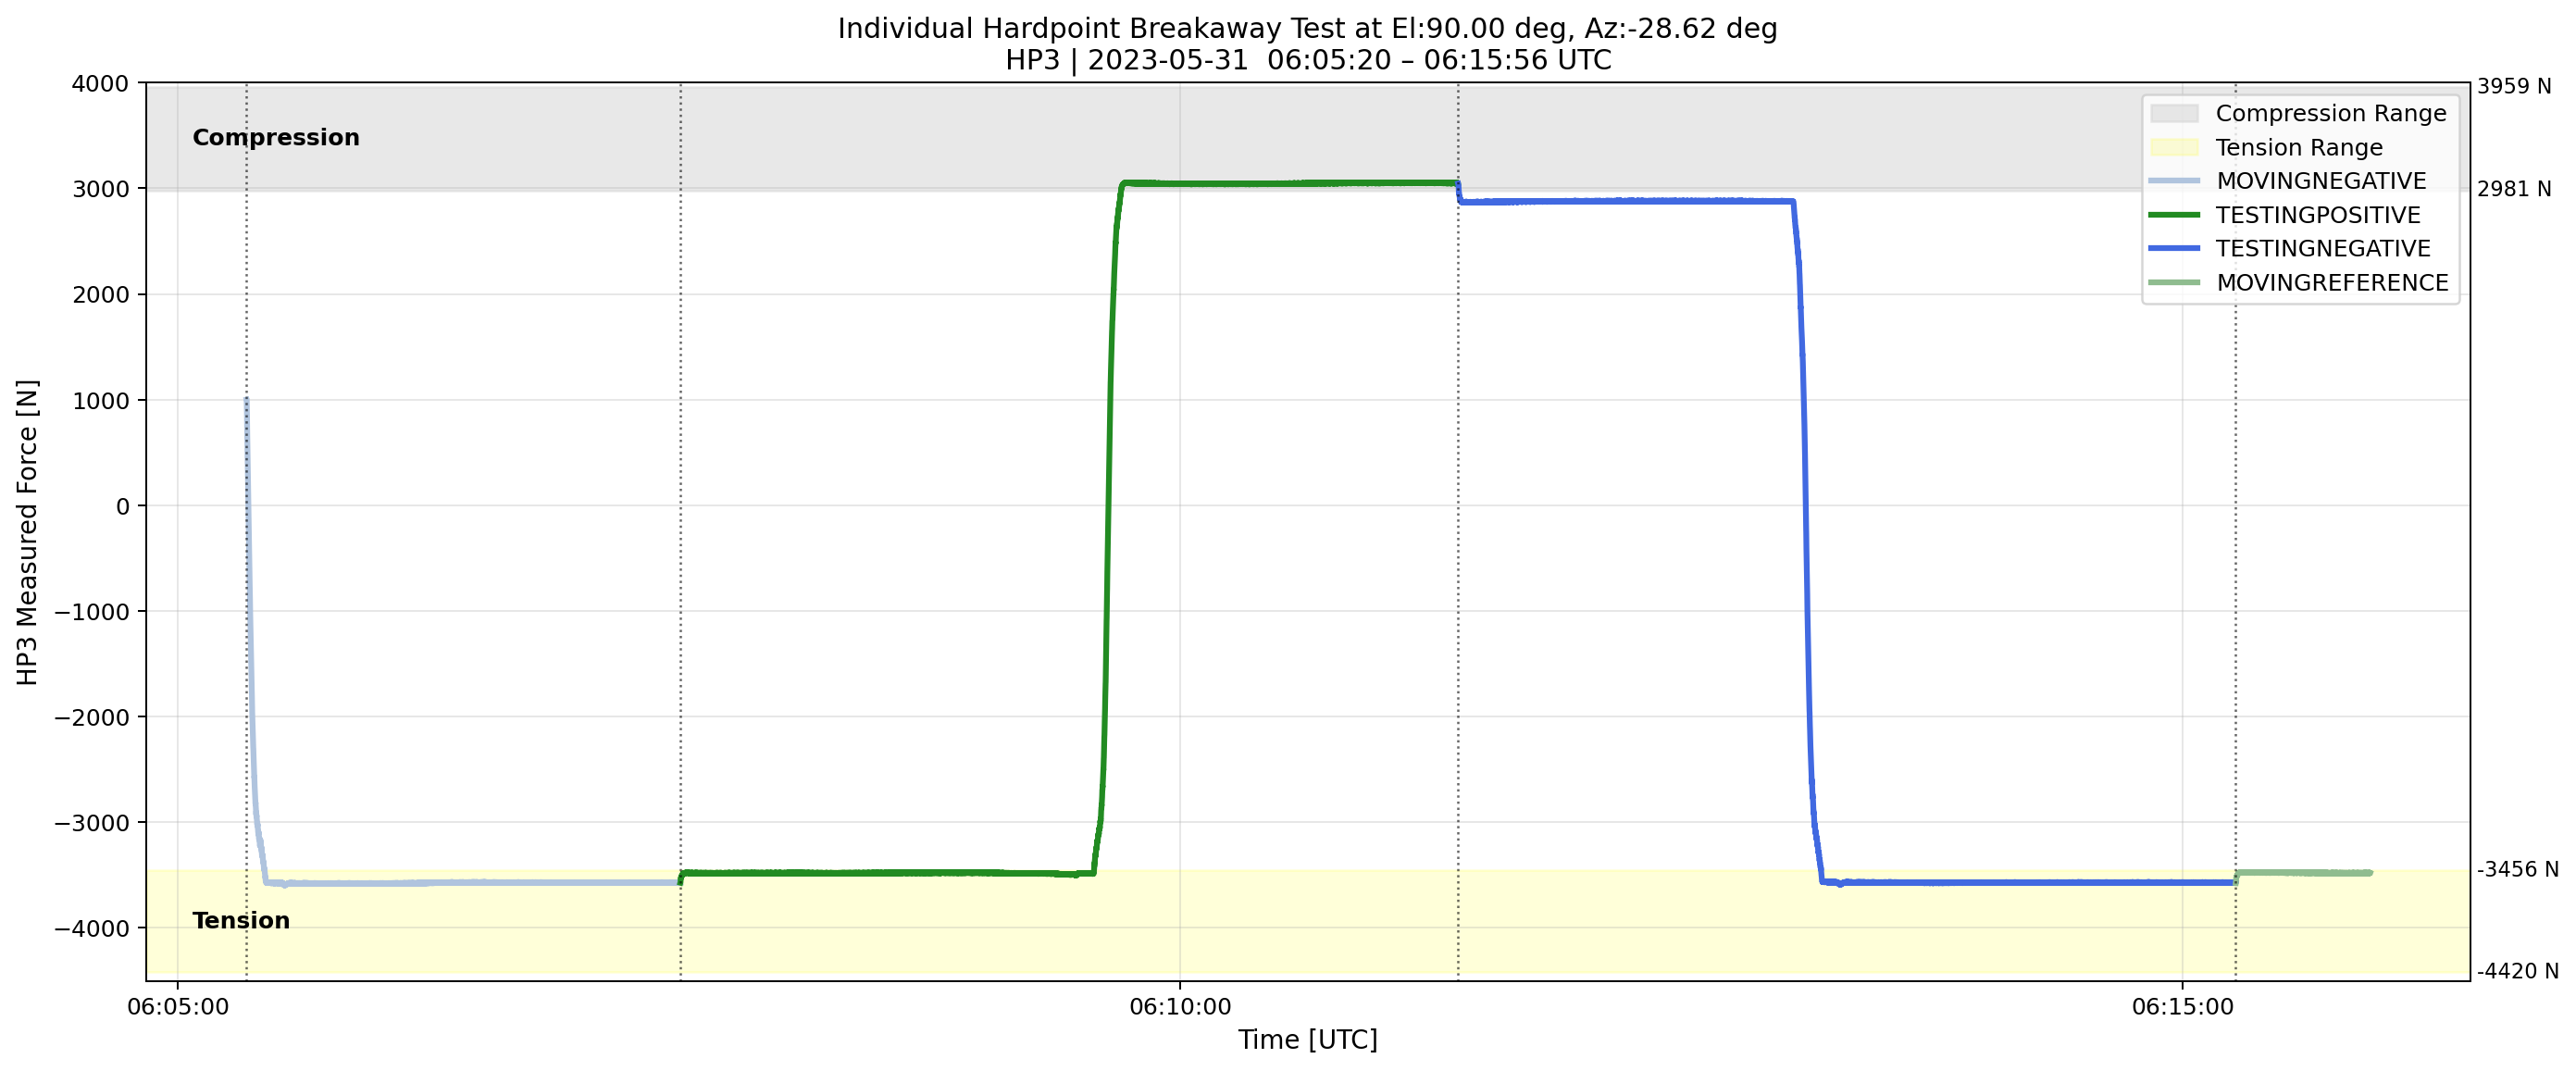
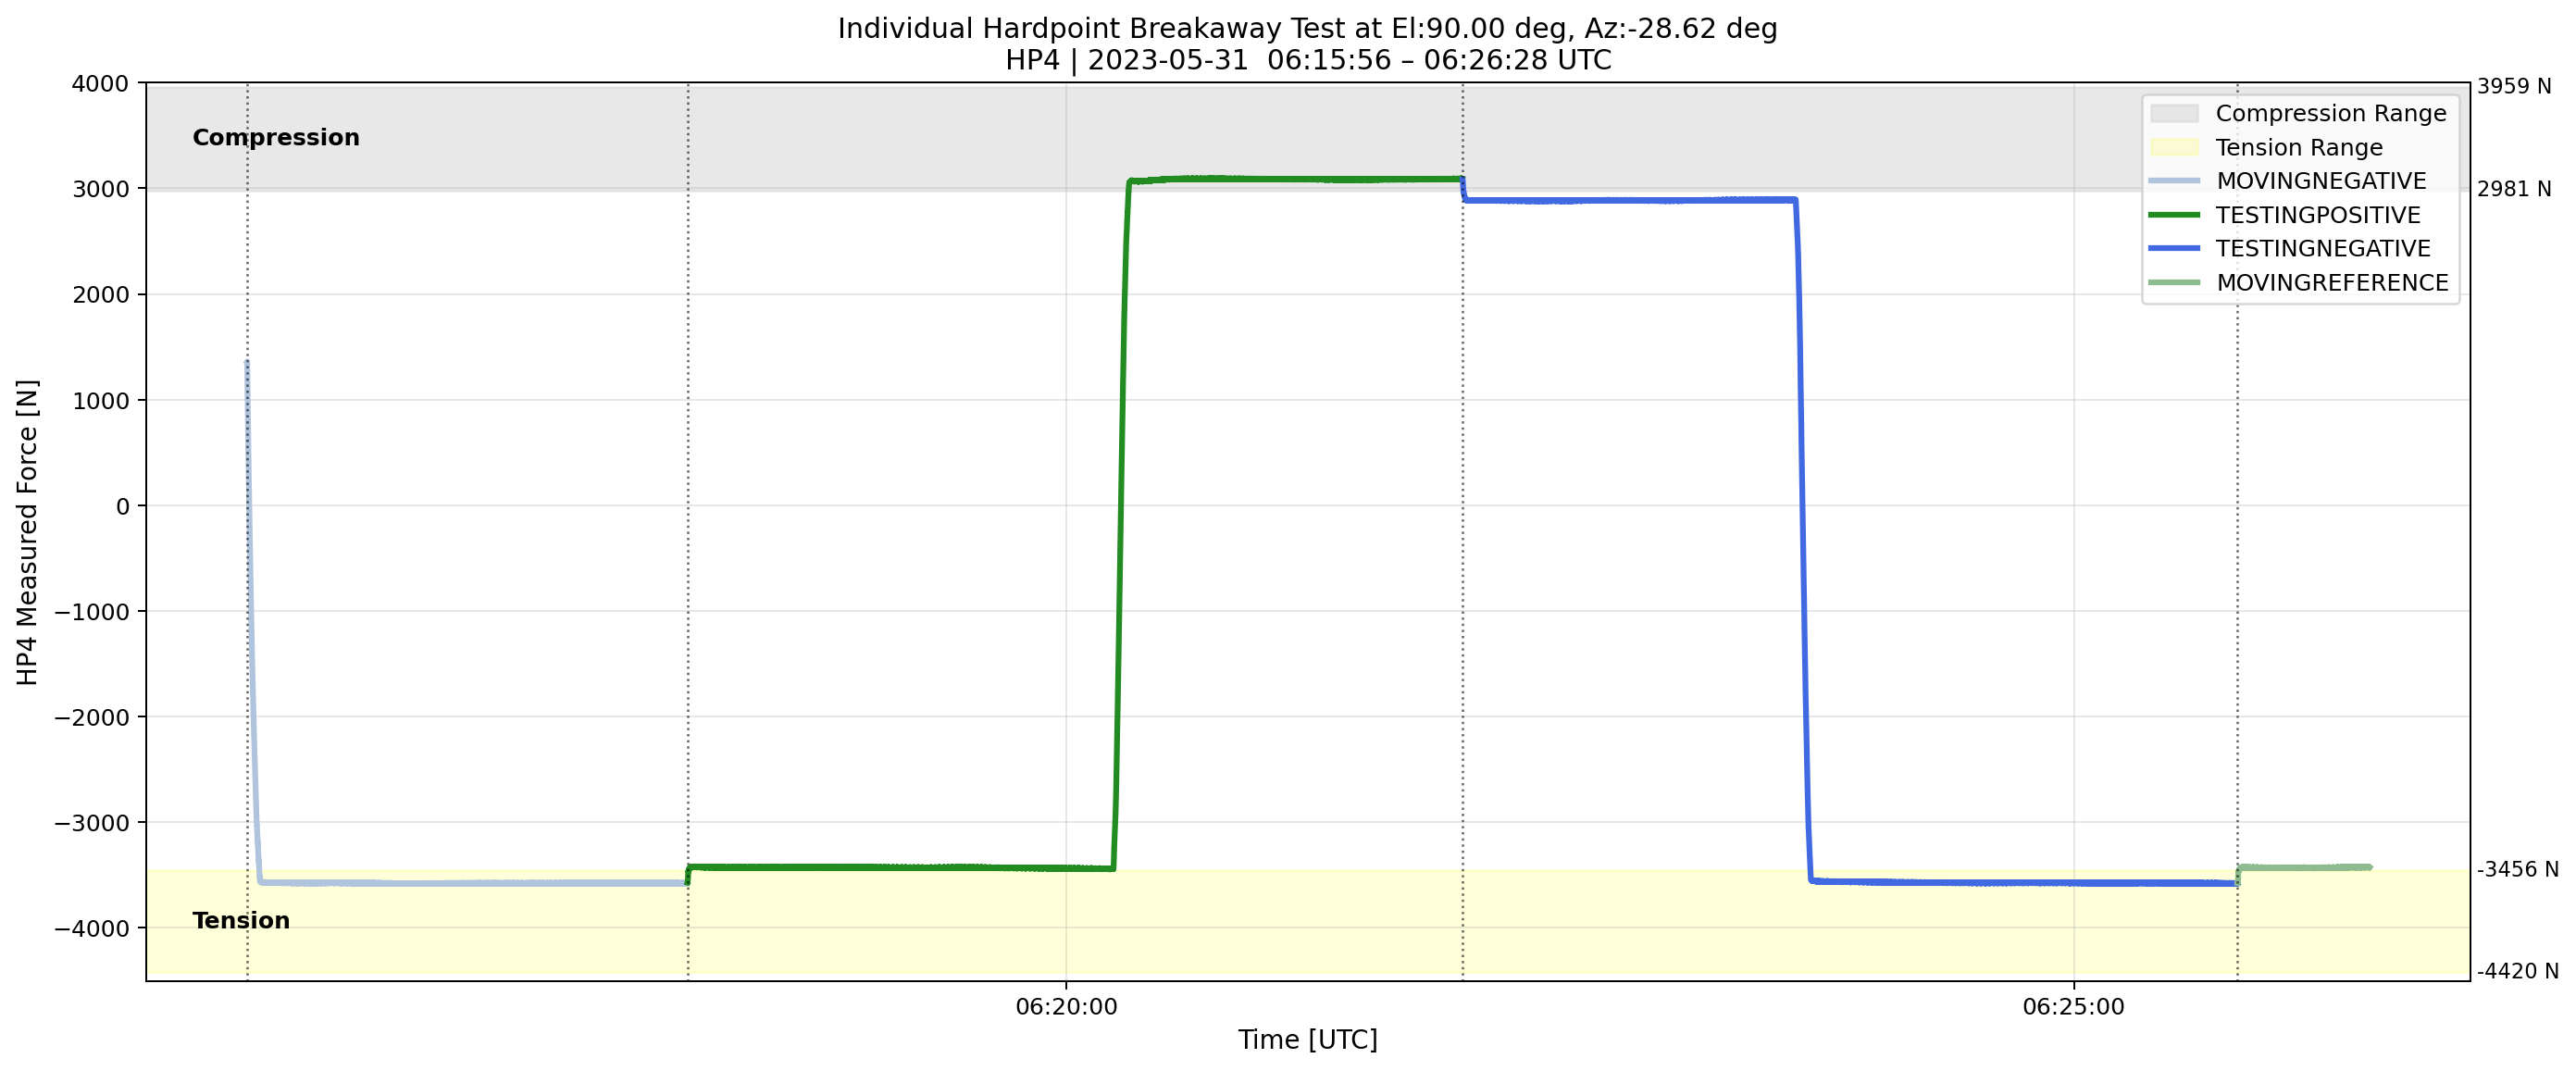
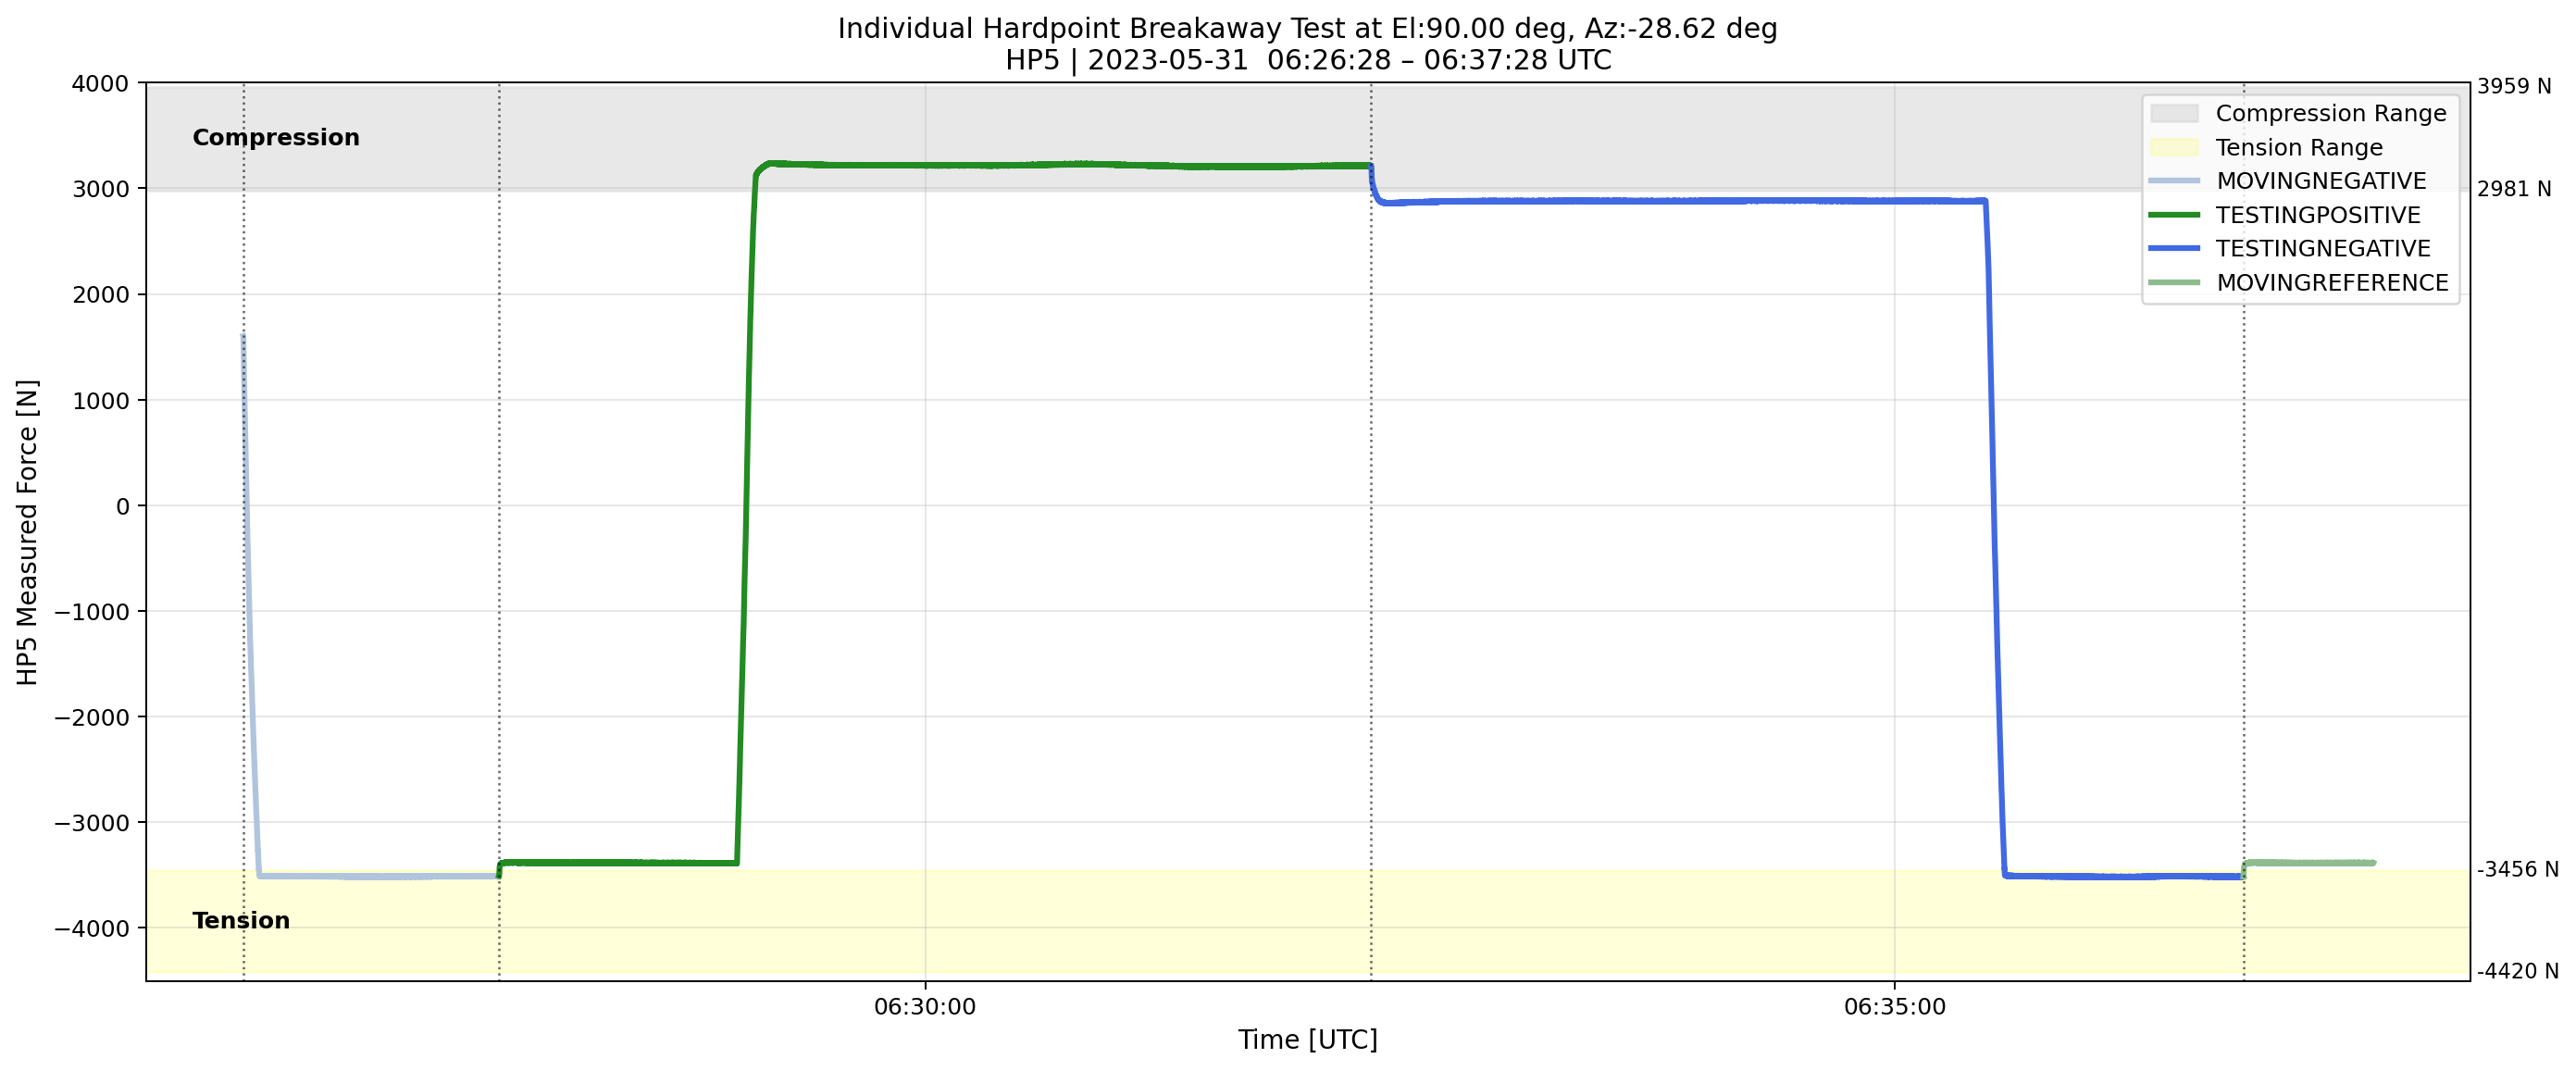
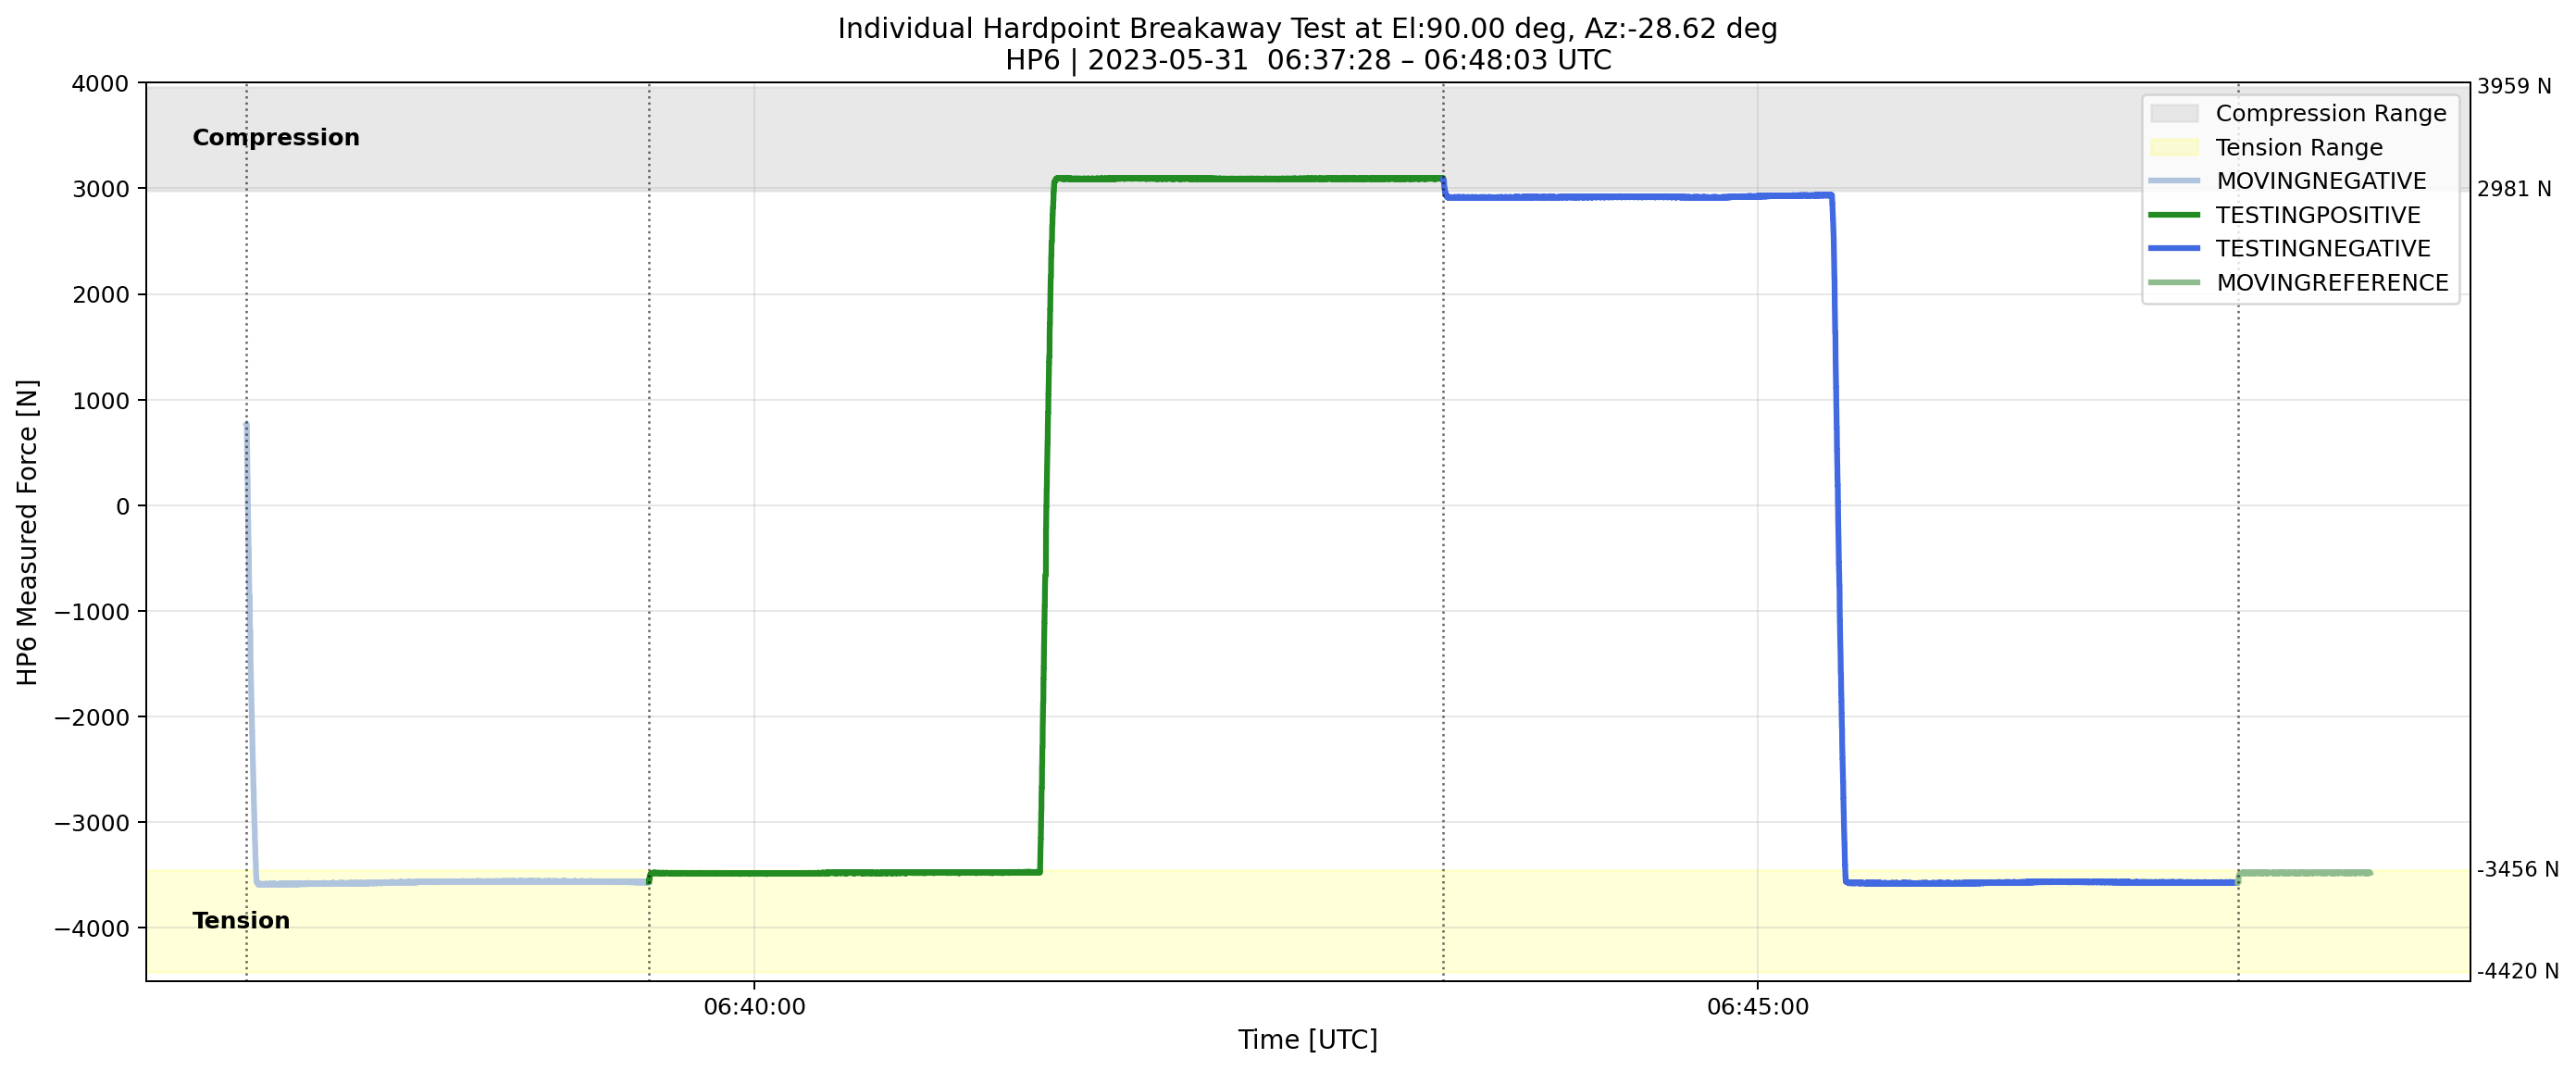
Fig. 1 Transition of the measured forces on each hardpoint when the TMA is at el=90deg.#
In Figure 2, there are the change of the measured force for each phase/status in the hardpoint breakaway test, moving Negative, testing positive, and testing negative, respectively. The stiffness of each curves are fitted with ±10 points from \(\Delta\)displacement = 0 \({\mu}m\). All stiffness slopes are shallower than specification (100N/\({\mu}m\)).
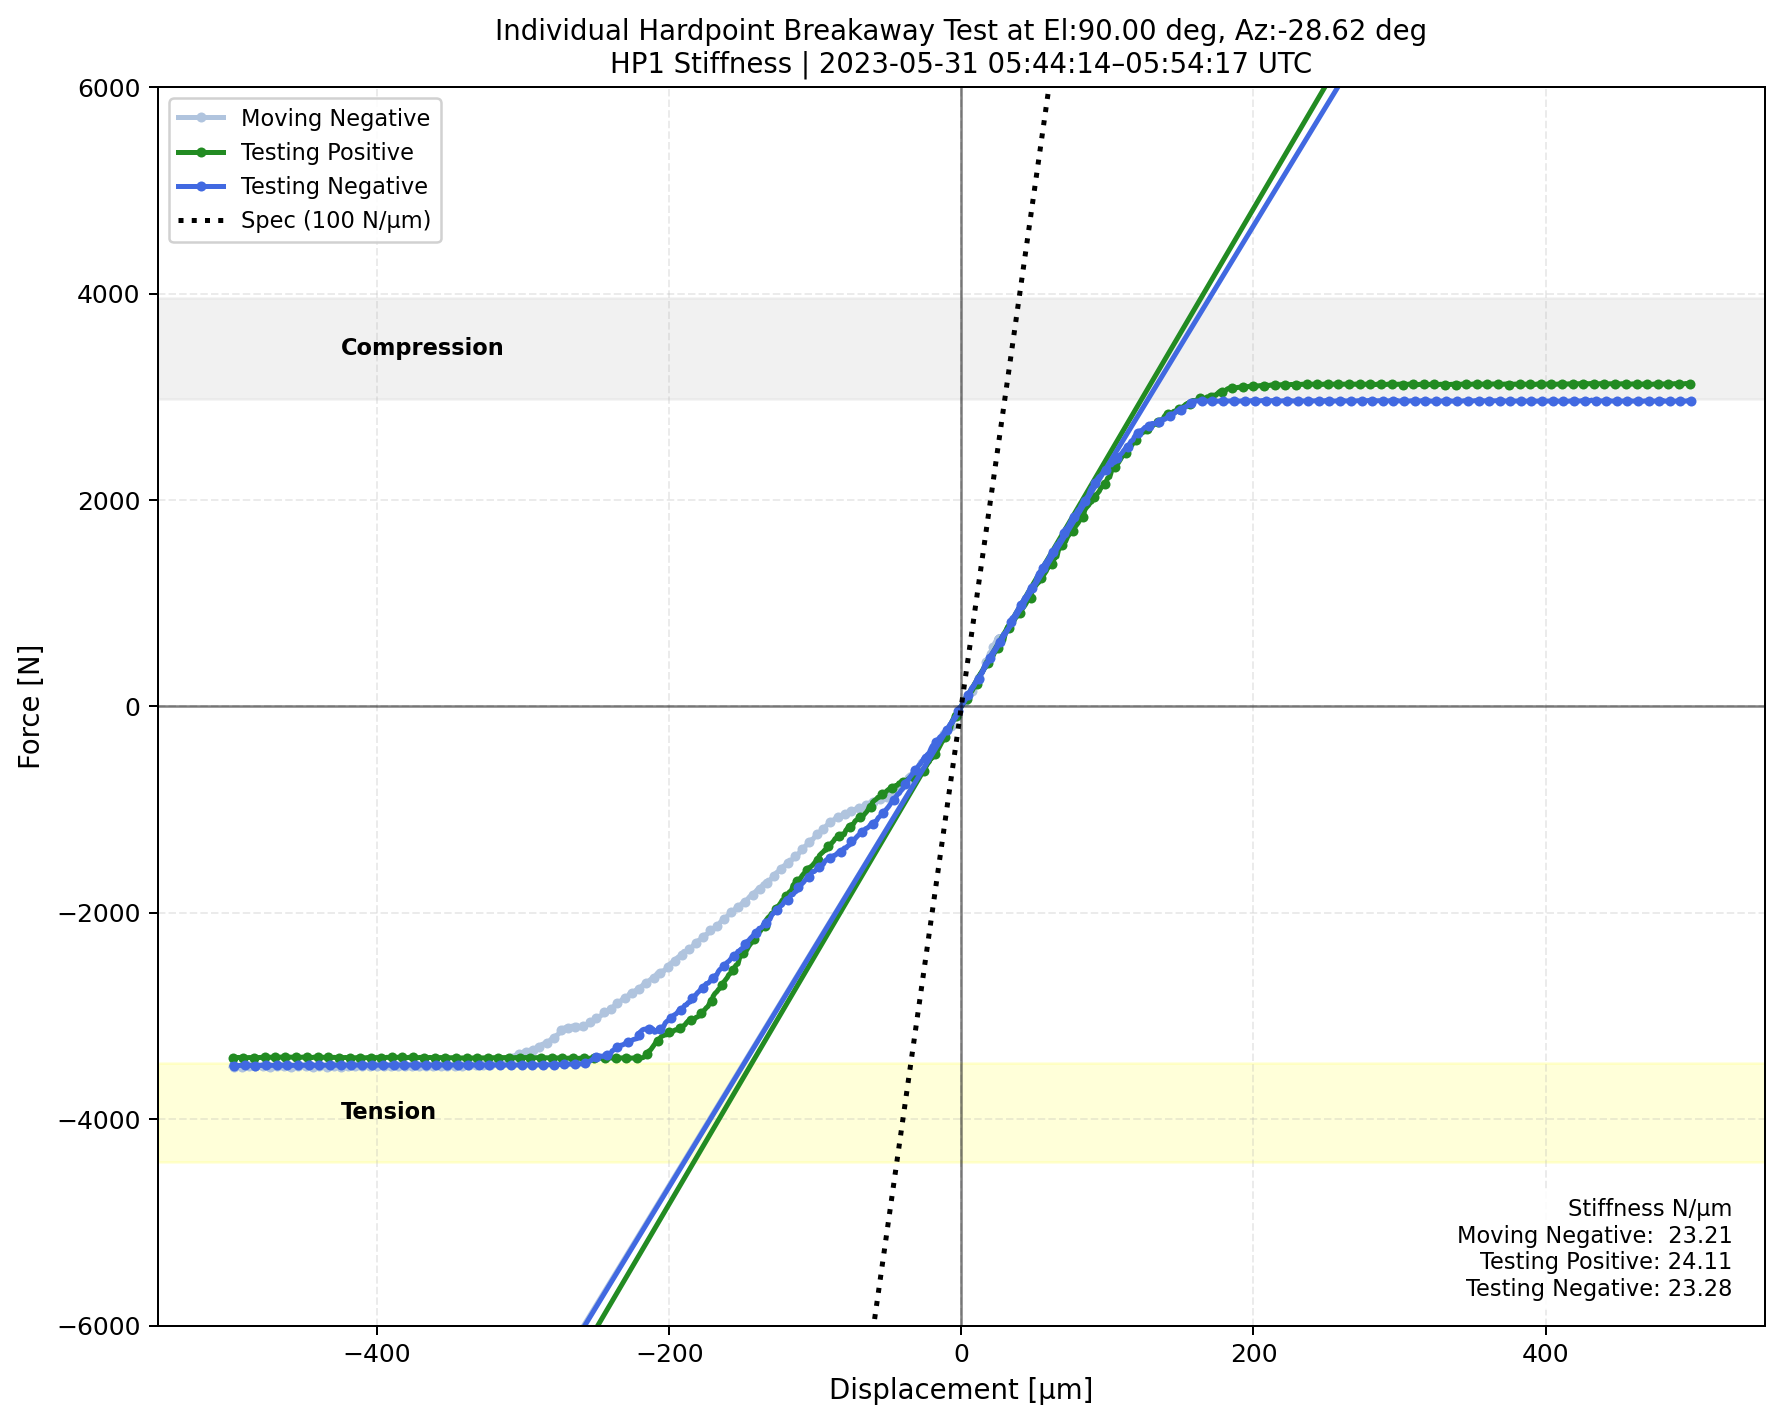
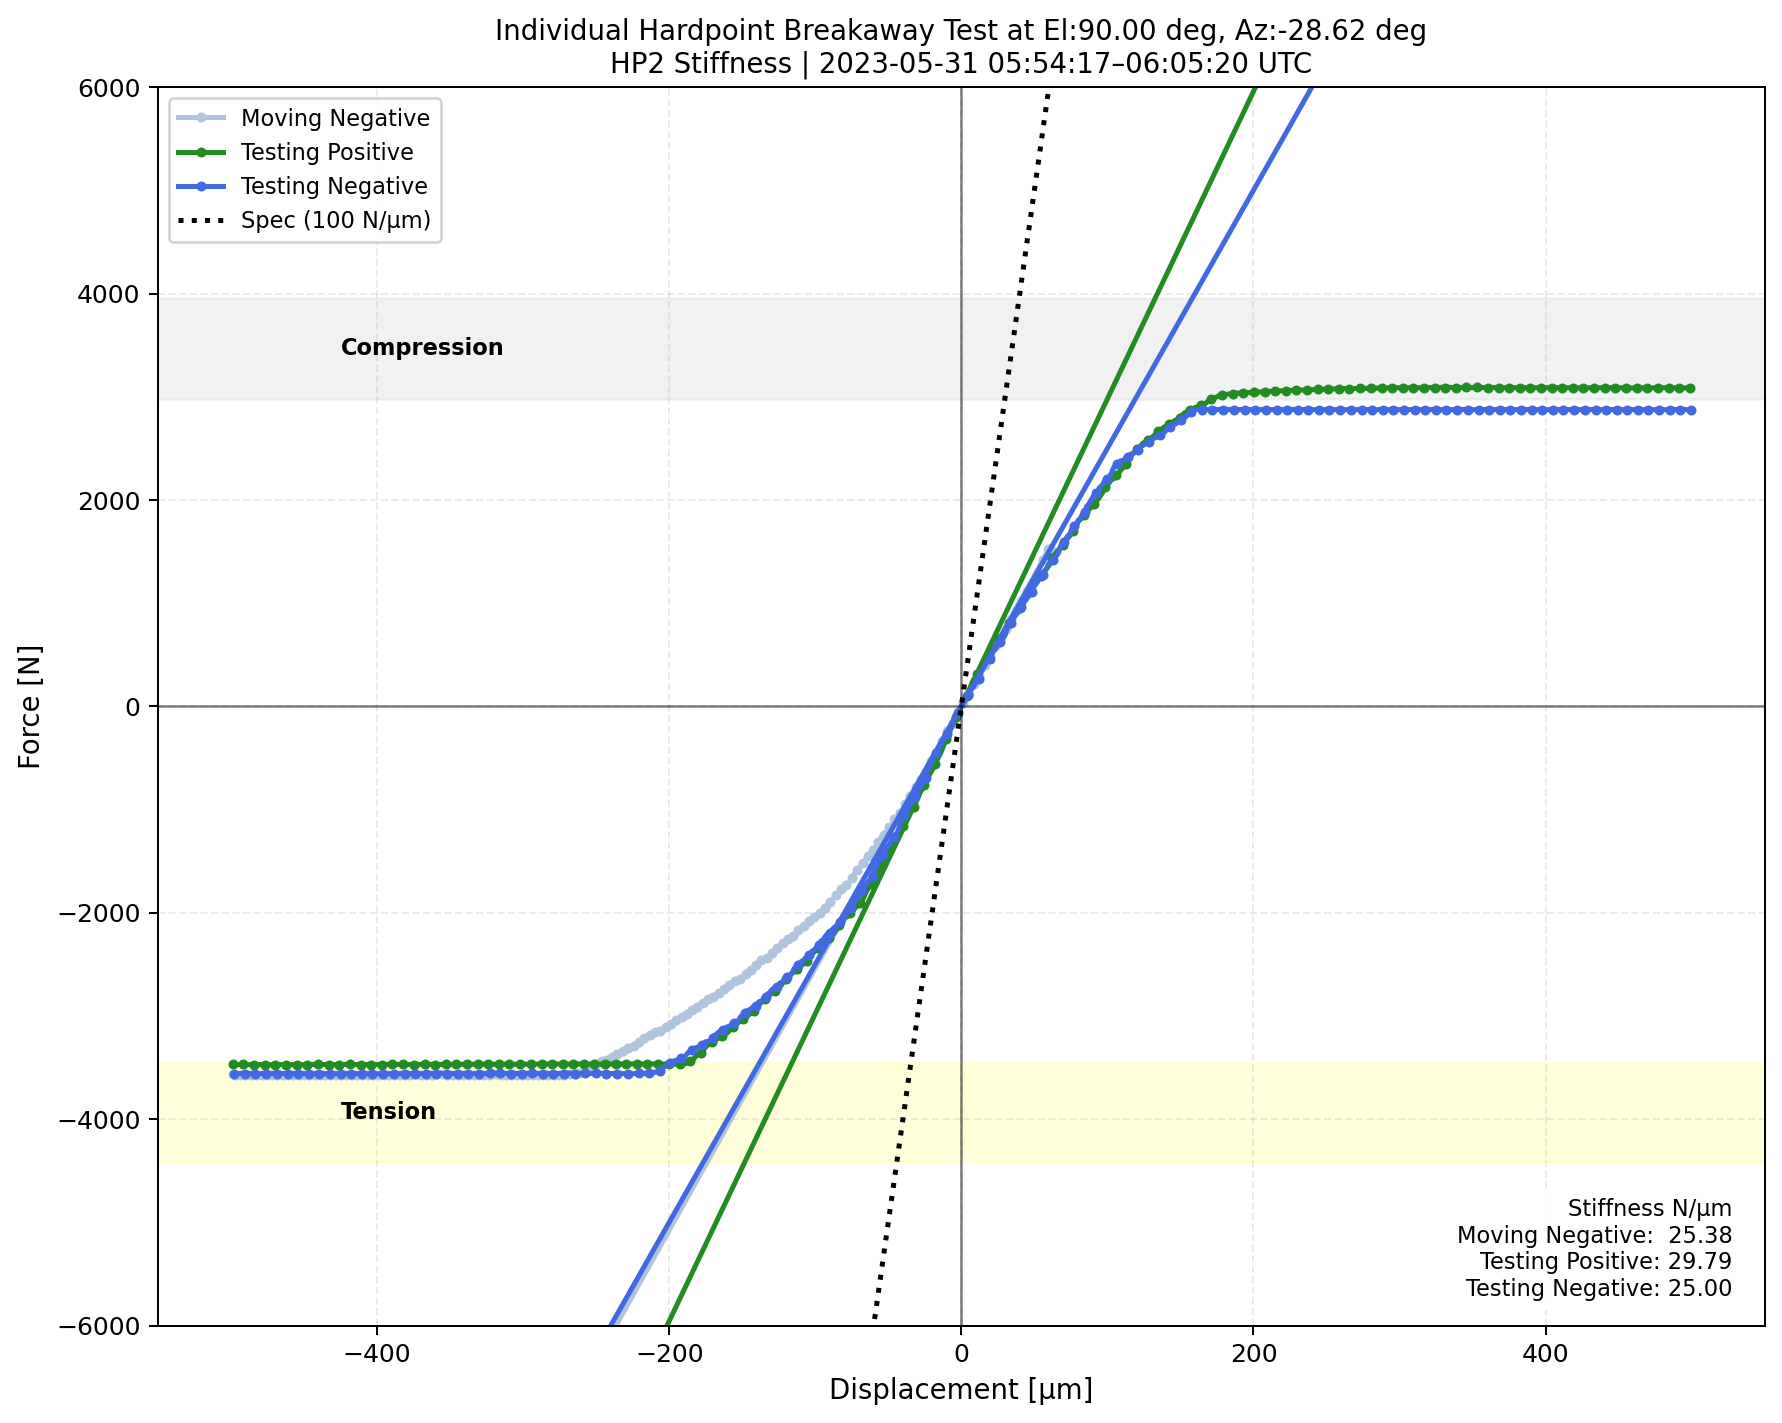
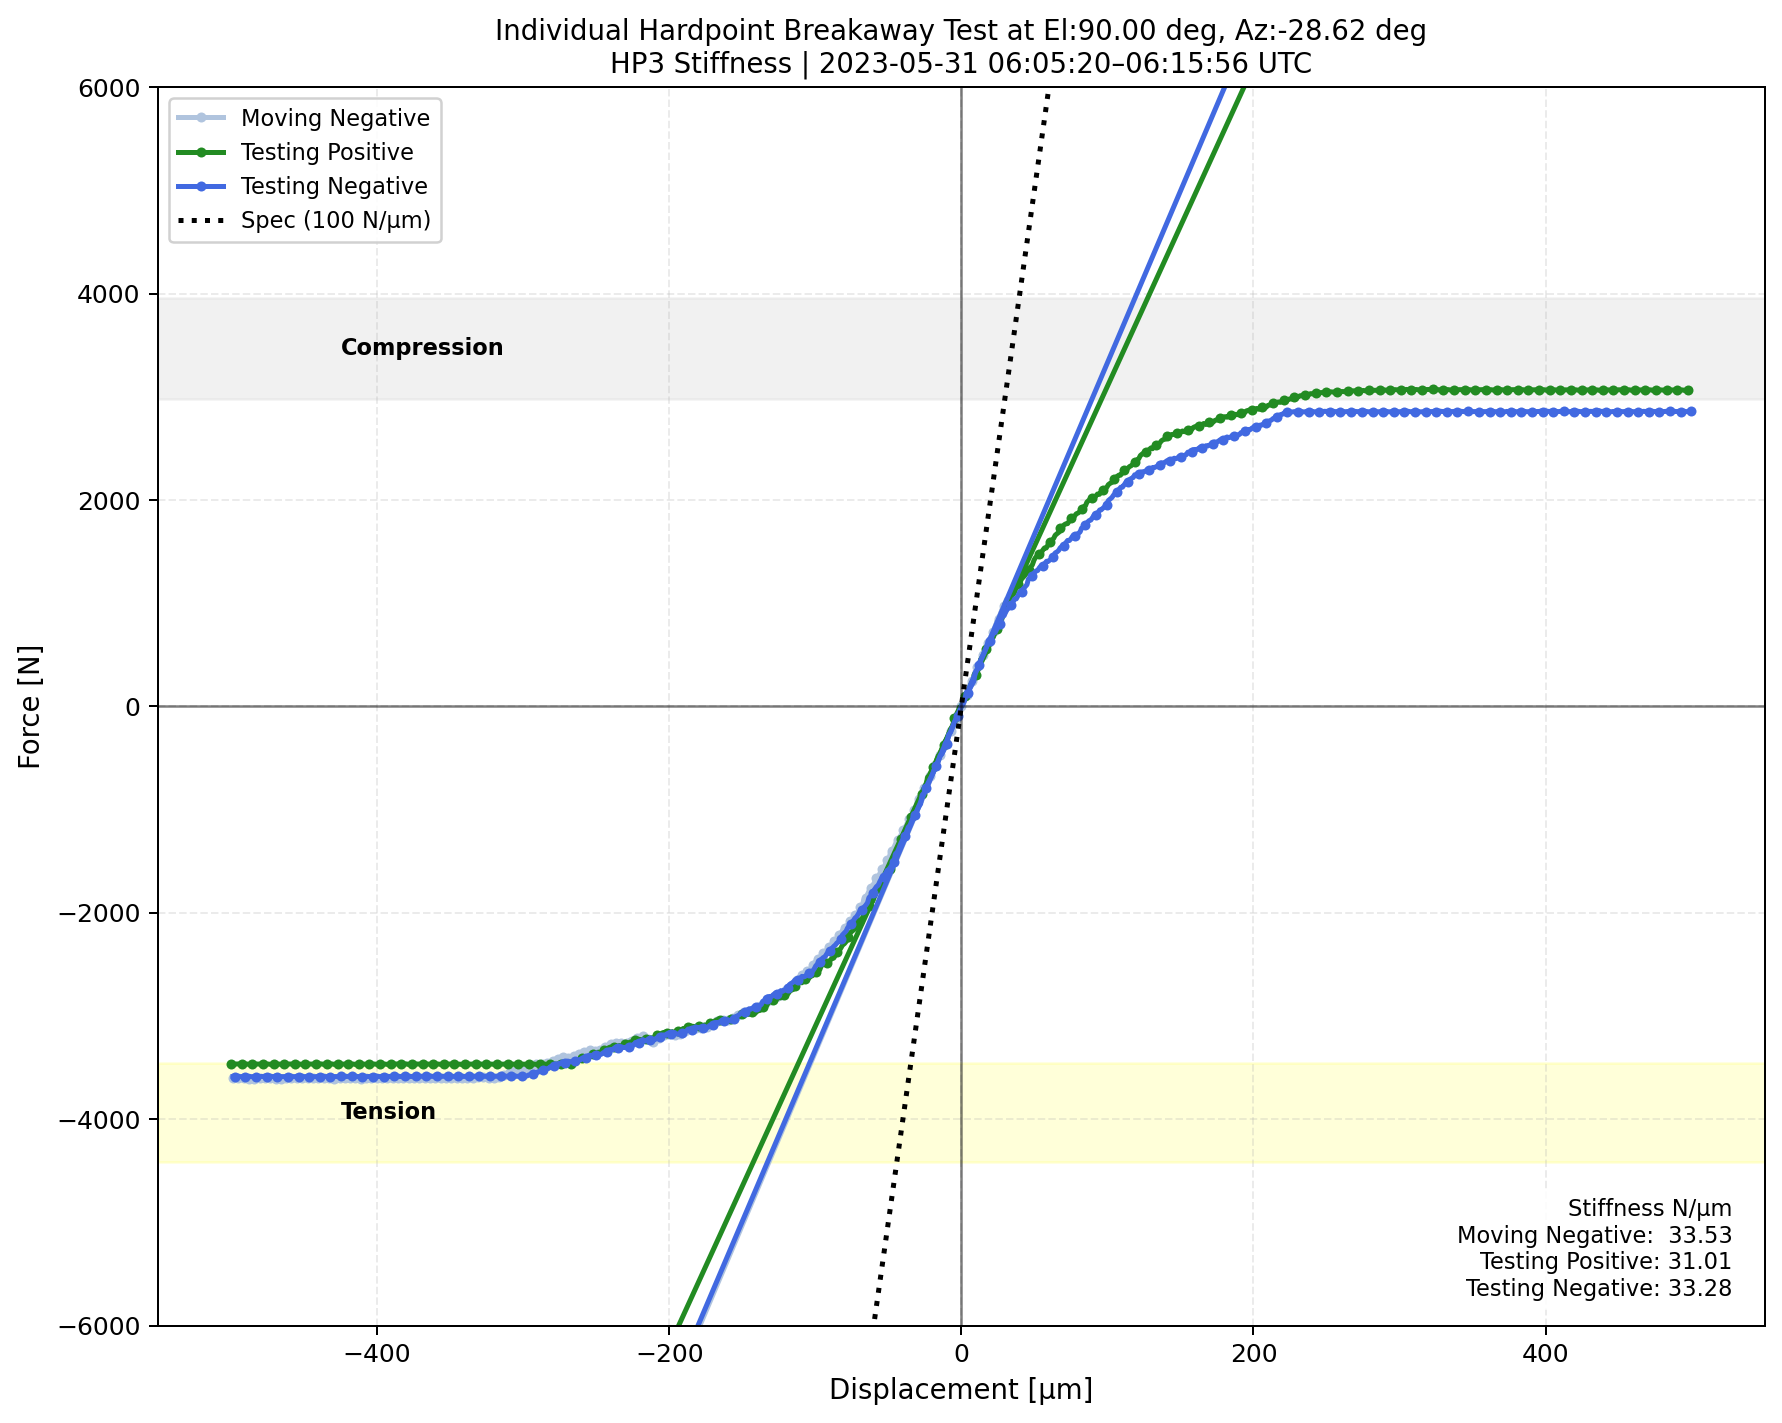

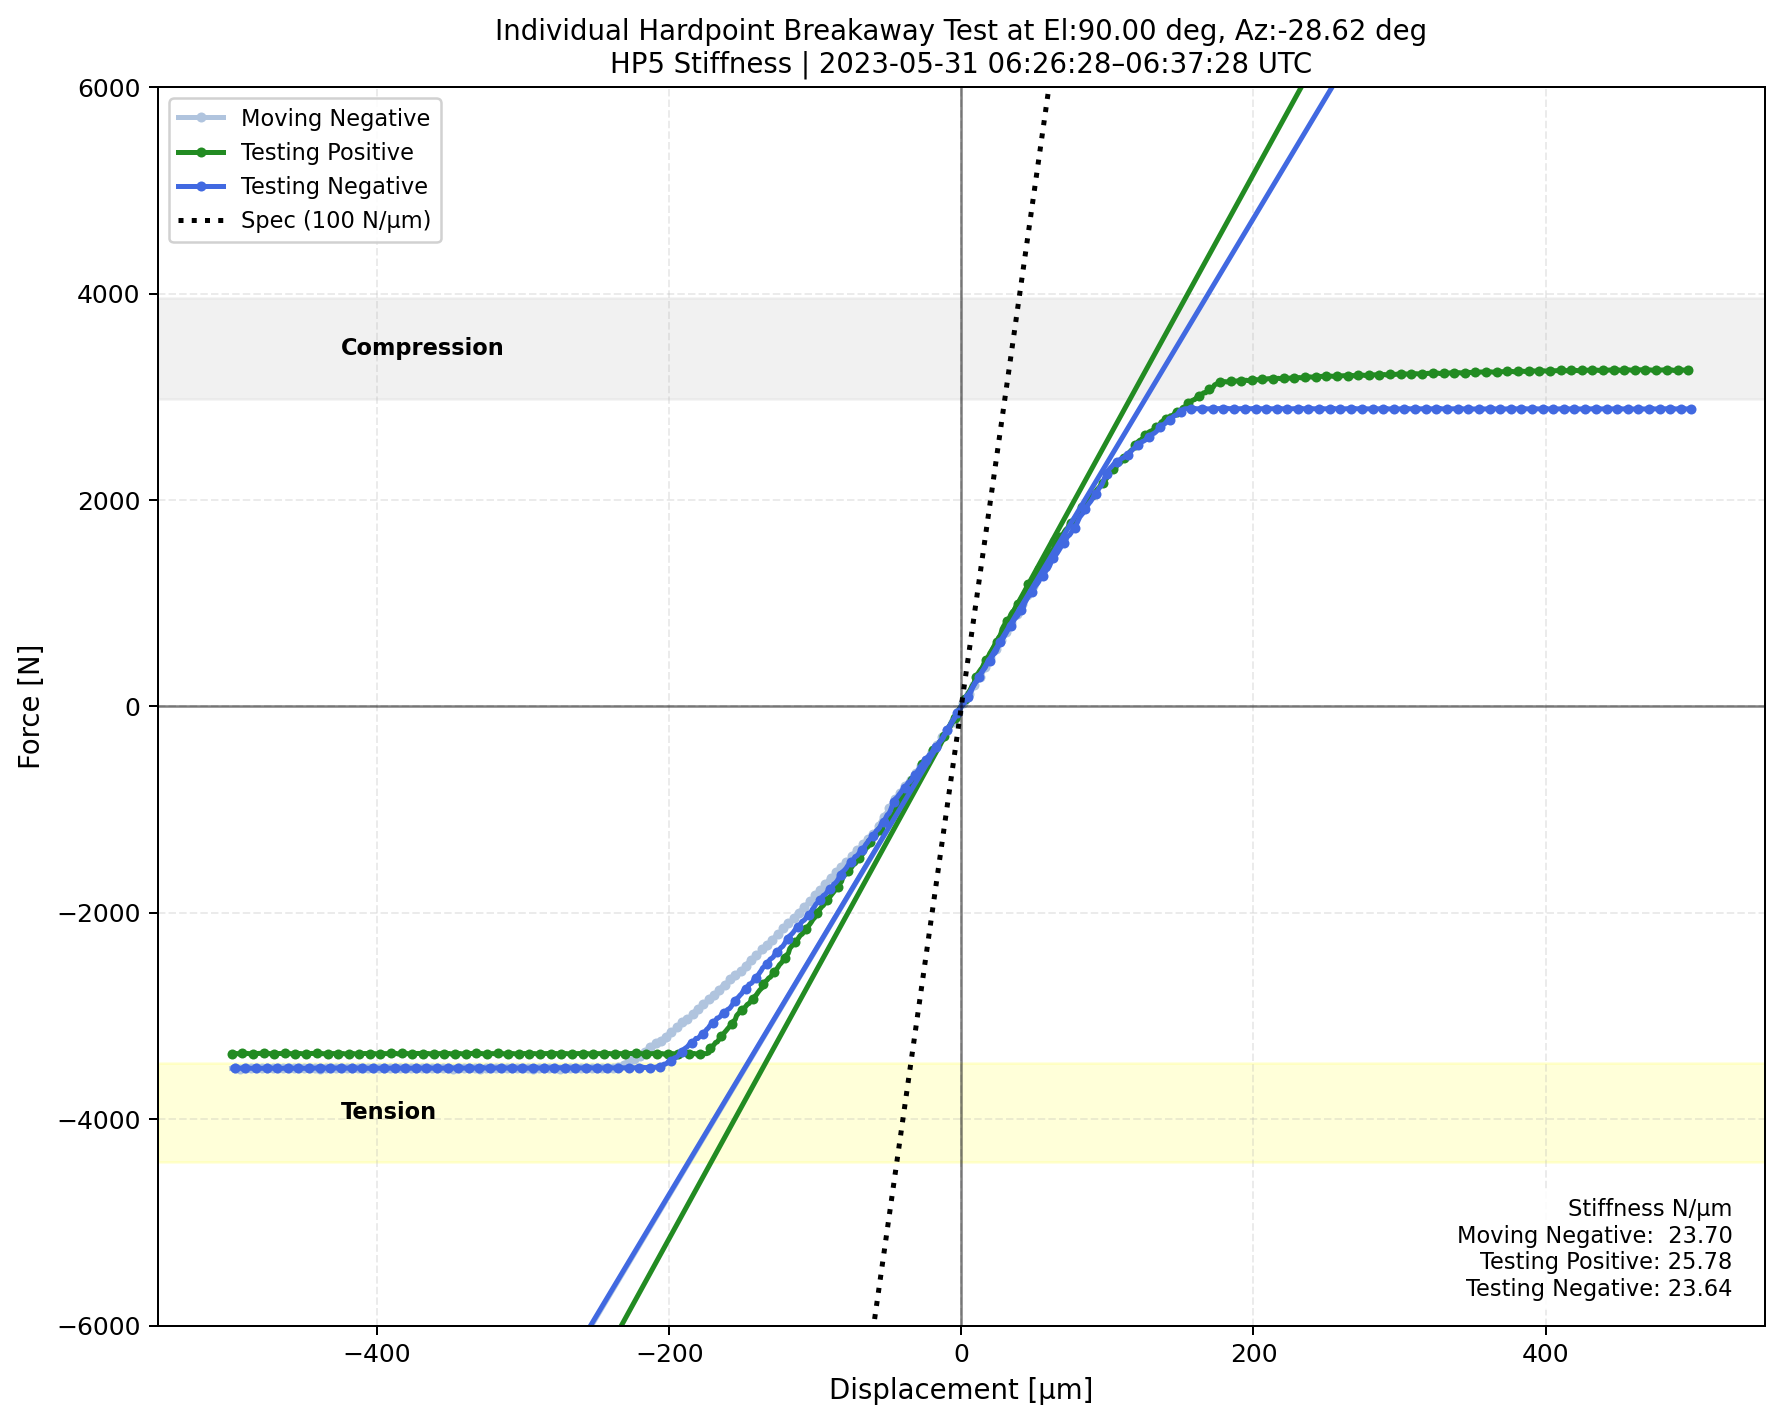
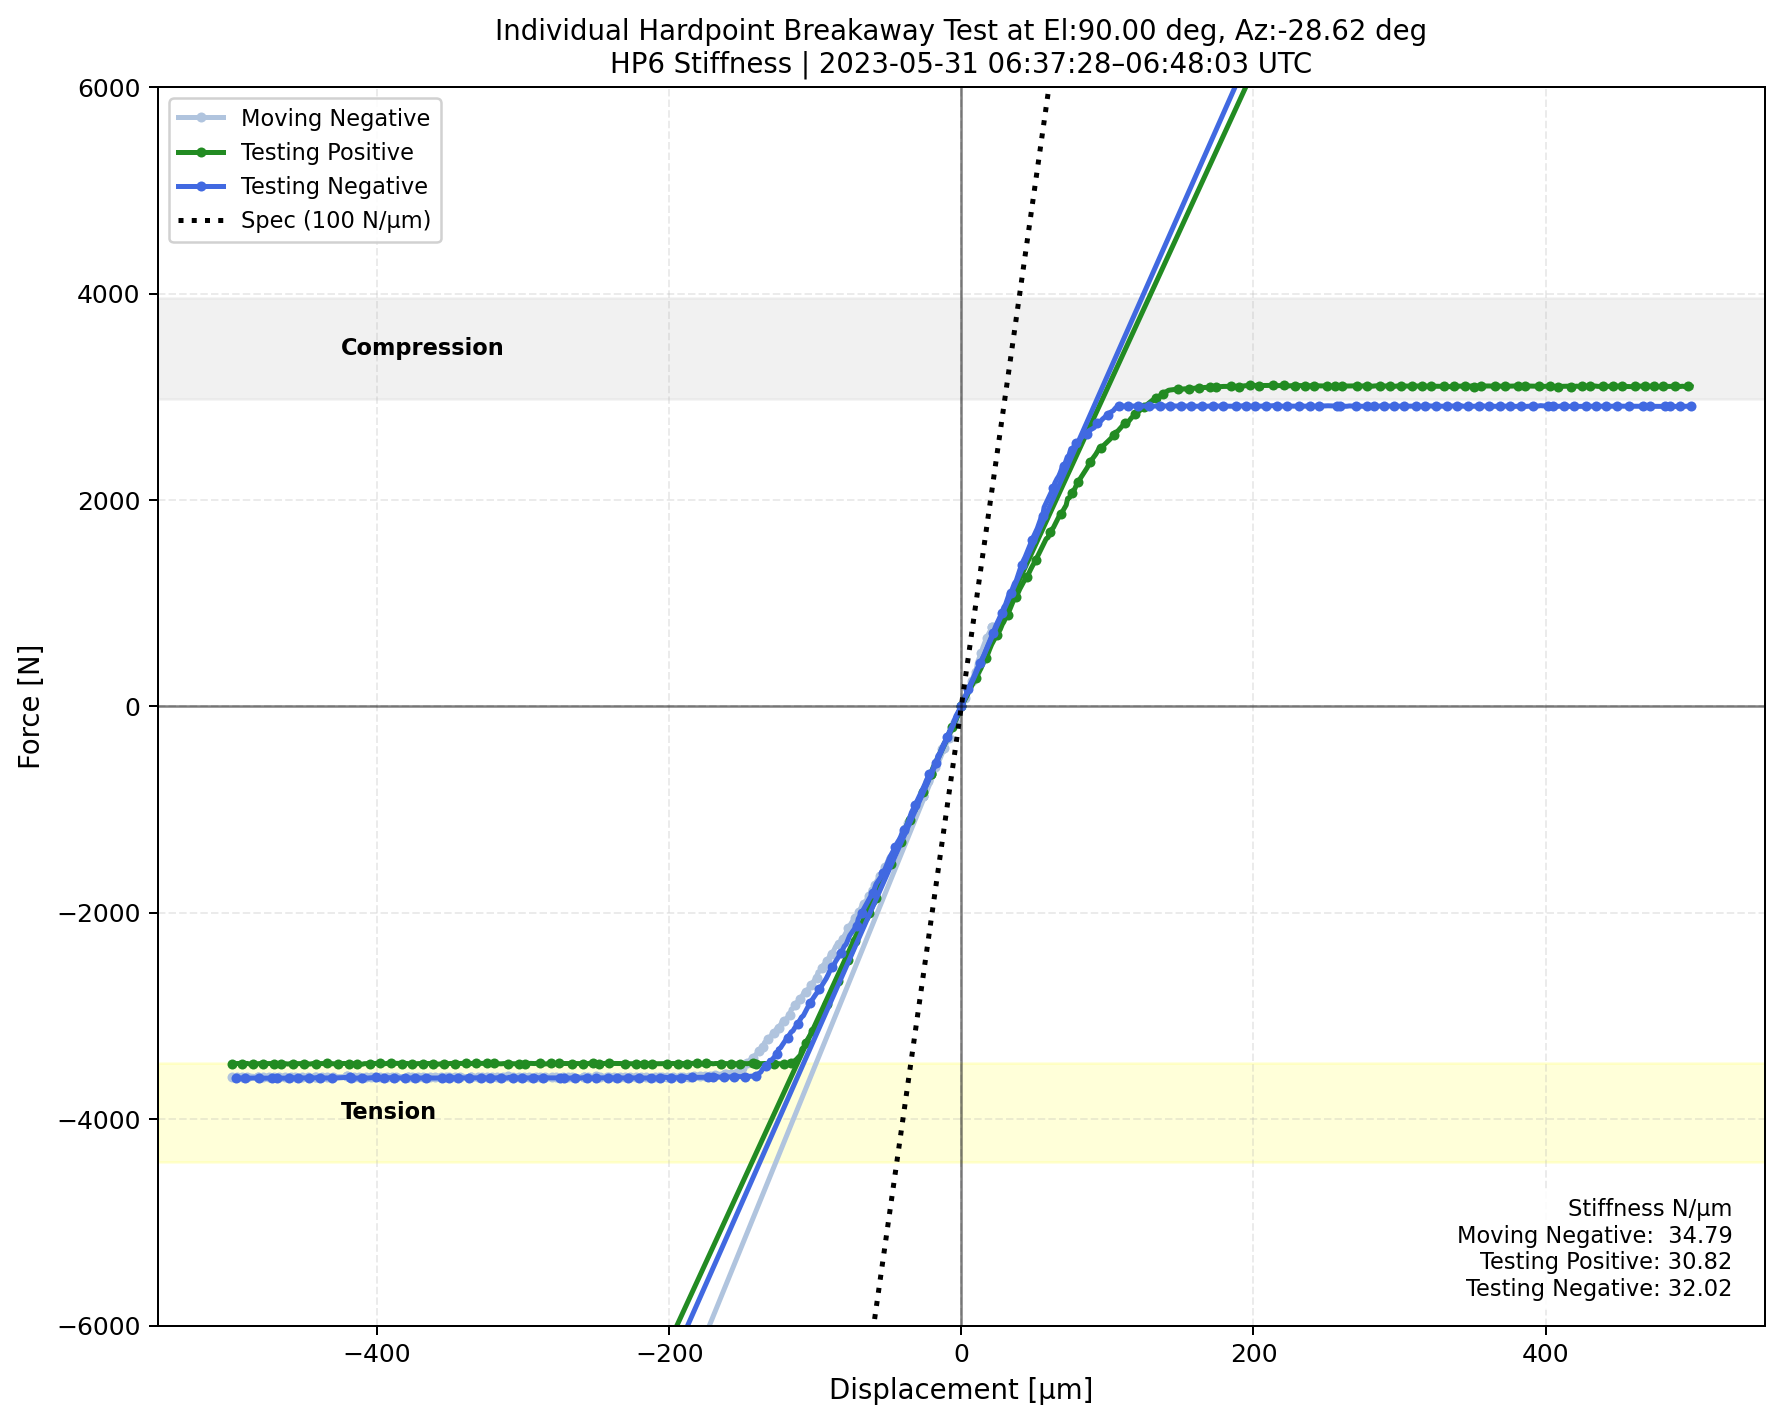
Fig. 2 <math>\Delta</math>Displacement versus measured forces for each phase during the hardpoint breakaway test when the TMA is at el=90deg.#
In order to check residual bumps during the movements of hardpoints, we adopted the error function (1) to fit the measured forces with respect to \(\Delta\)displacement for active phases when the hardpoints are moving toward negative and positive directions. As hardpoints breakaway limits for each direction are different, the functions at the positive and negative in x axes were fitted separately. The maxima of the bumps are about < 250N, which correspond < 10% of the measured forces.
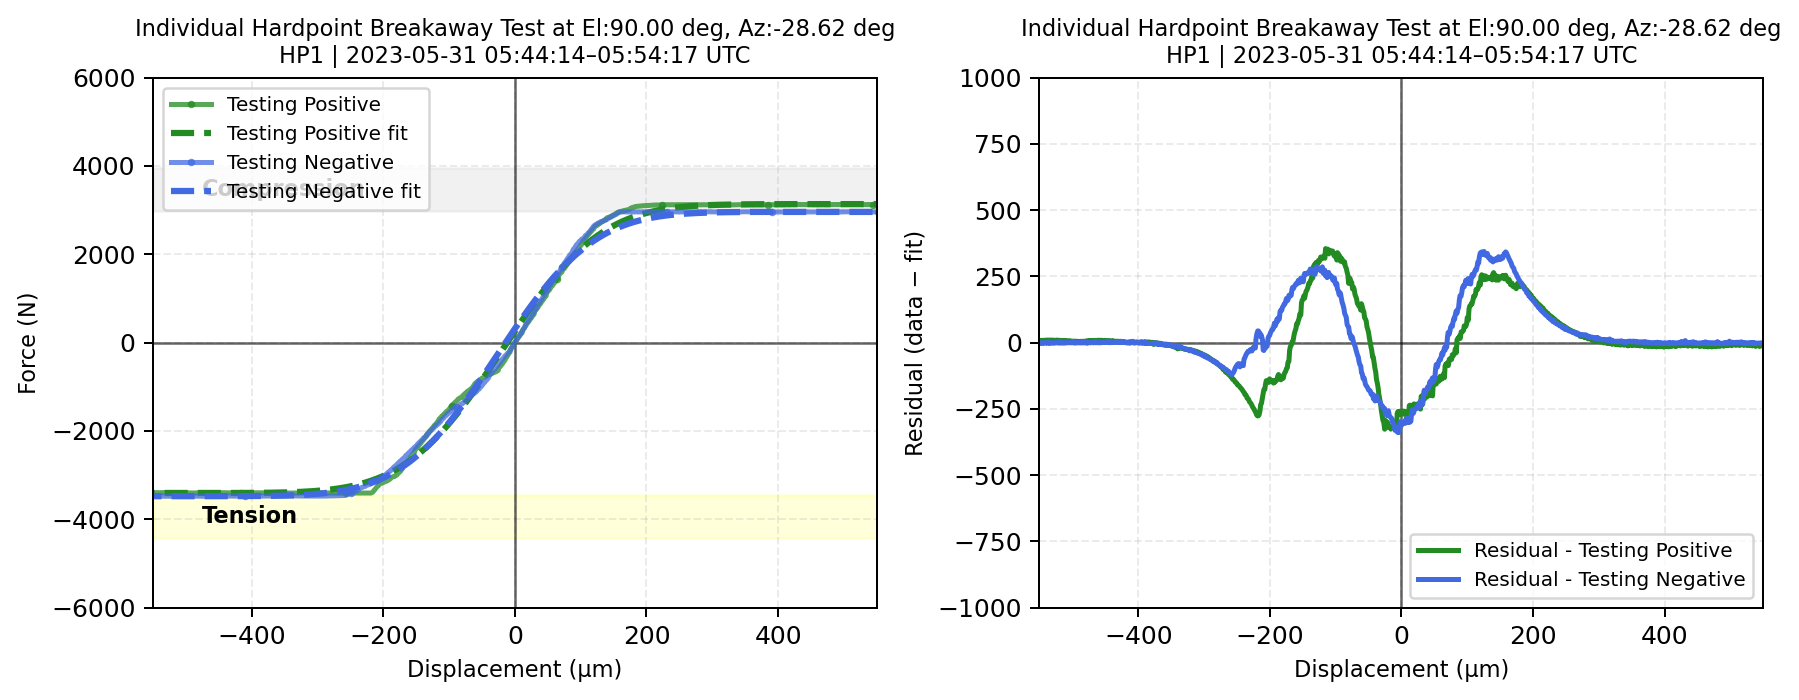

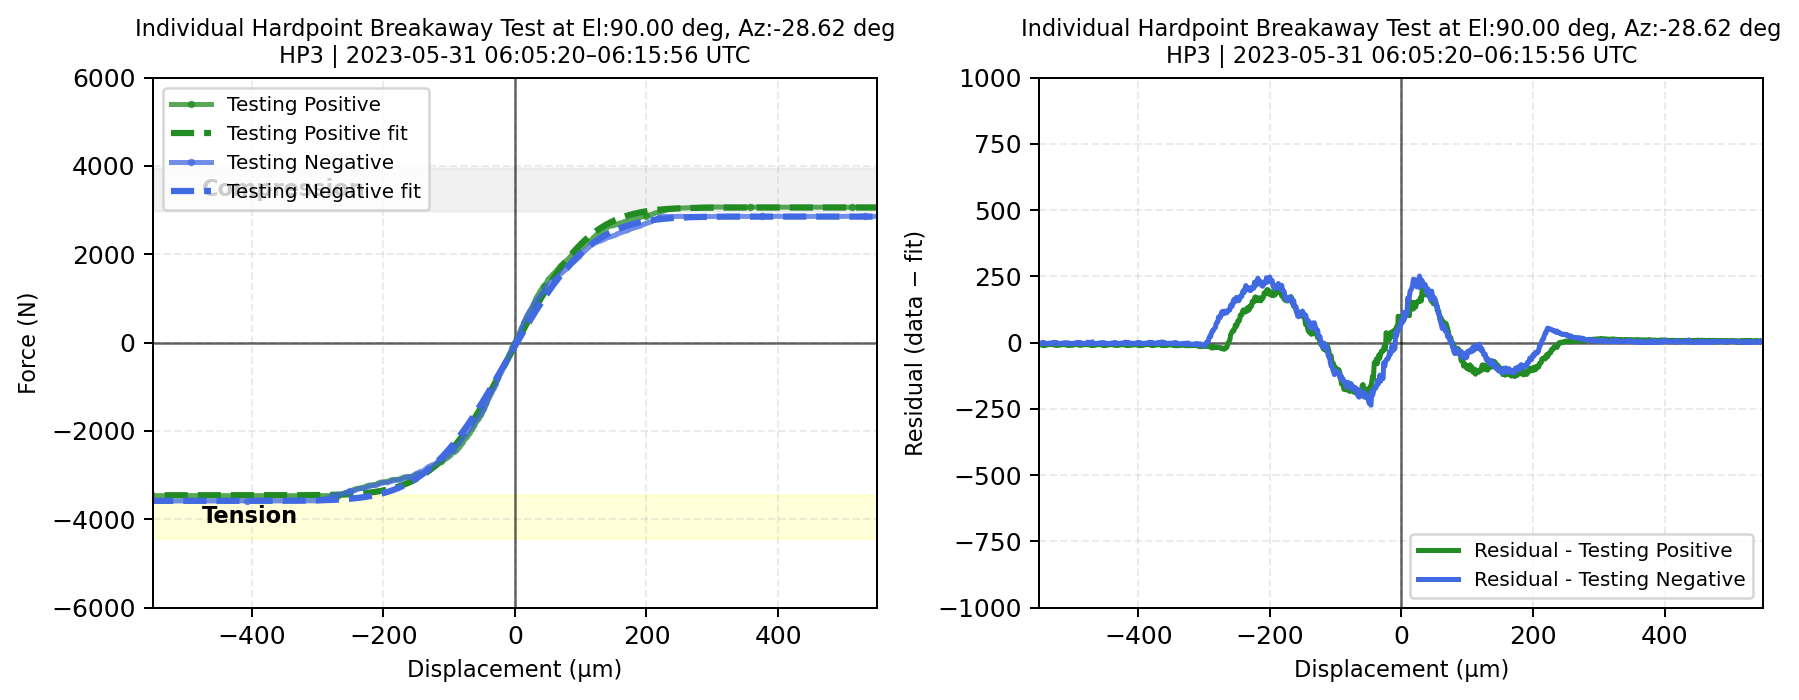
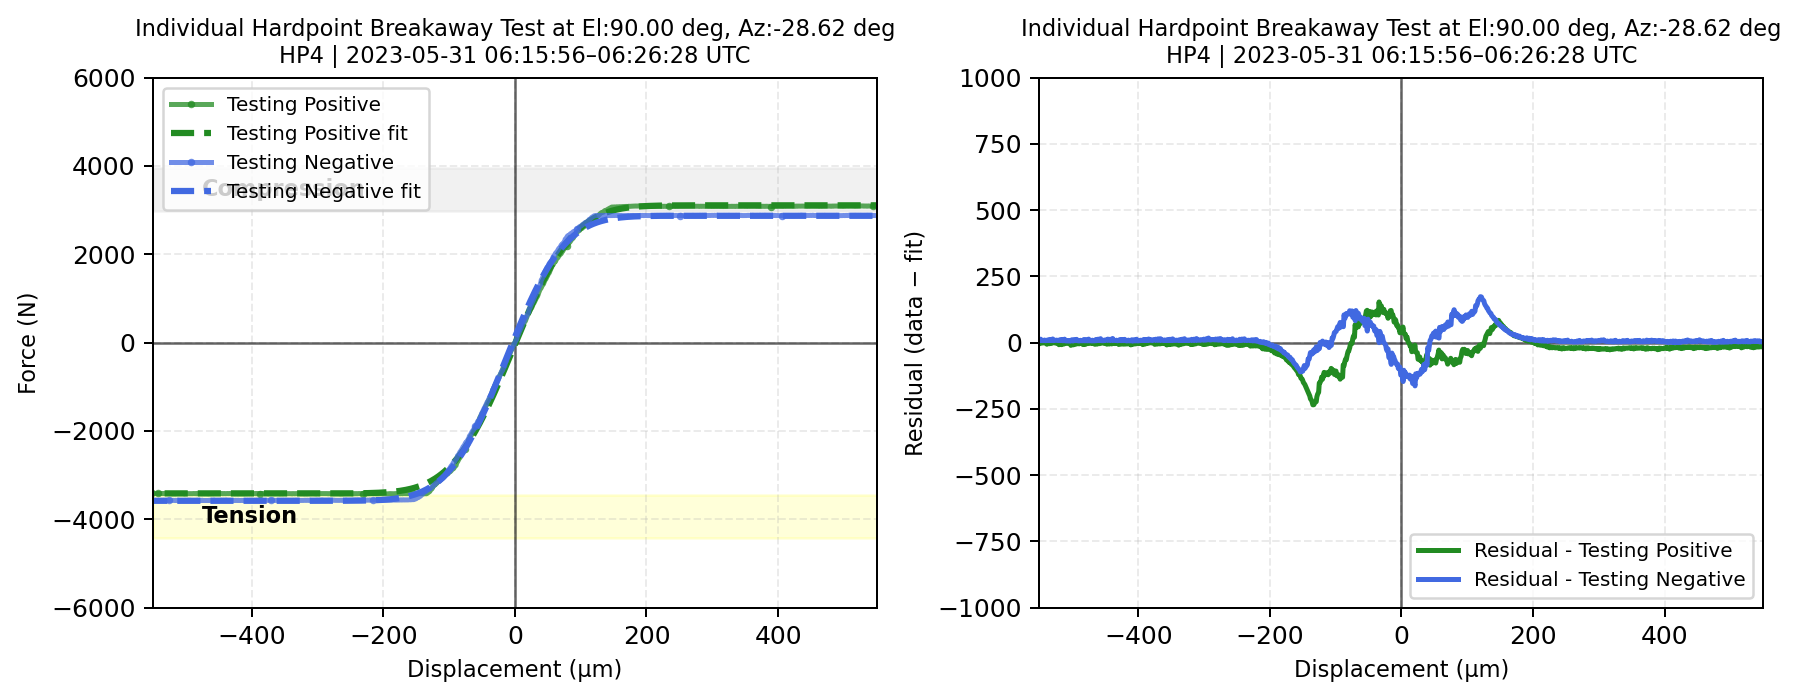
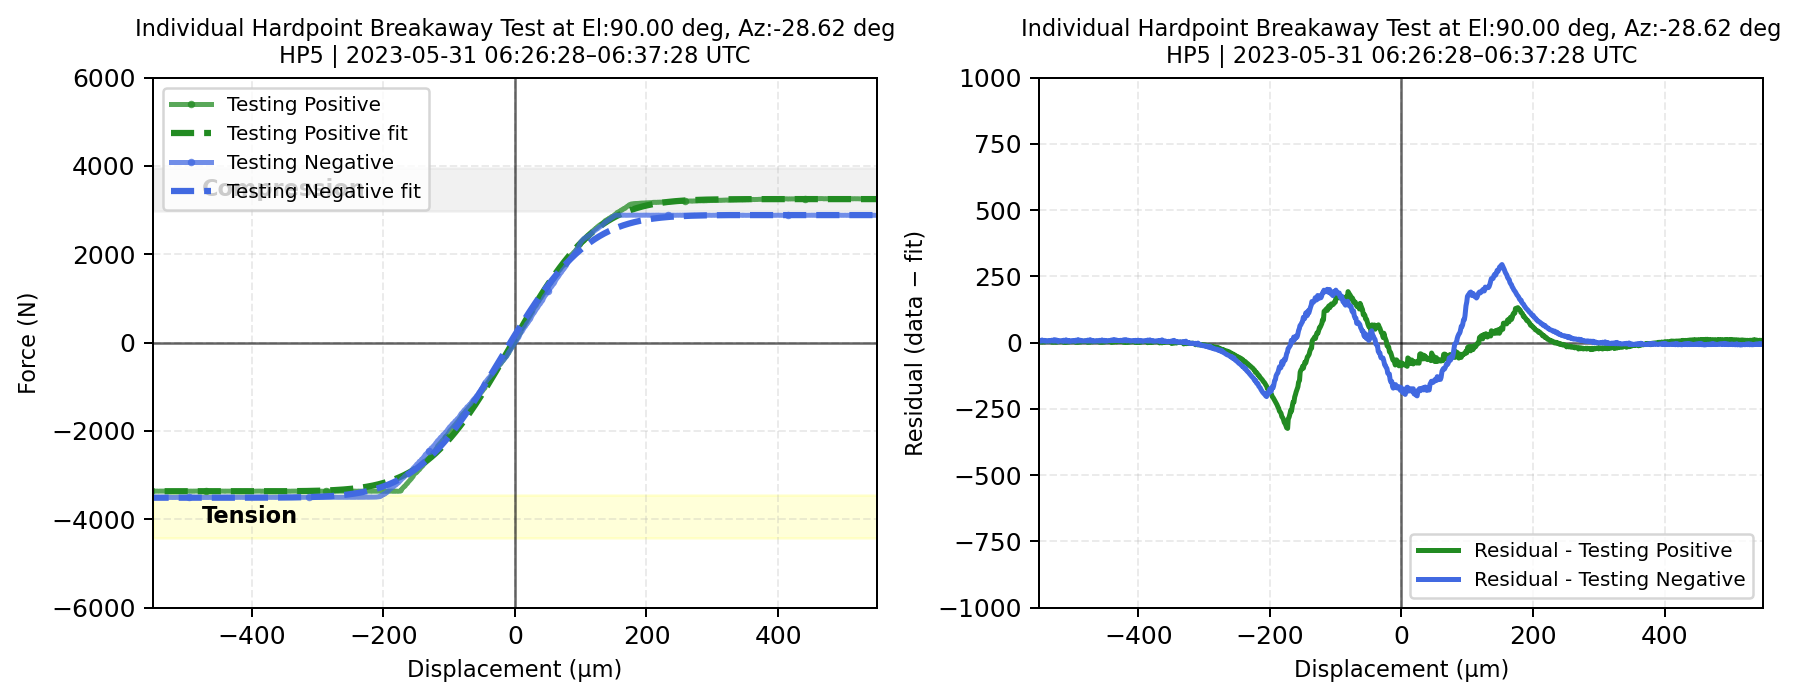

Fig. 3 (Left) \(\Delta\)Displacement versus measured forces for each phase during the hardpoint breakaway test fit with error function (the TMA at el=90deg). (Right) The residual, a difference between data and error function, with respect to \(\Delta\)displacement#
HP Test at el 0 deg#
These are results from hardpoint breakaway test when the TMA was positioned at el=0 deg, az=-29.69 deg. In F(Left) \(\Delta\)Displacement versus measured forces for each phase during the hardpoint breakaway test fit with error function (the TMA at el=90deg). (Rig>igure 4, hardpoint 2 and hardpoint 5 were not moving to the positive direction. Hardpoint 1 and hardpoint 6 were both staying on the position for testing positive for a shorter period of time whereas hardpoint 3 and hardpoint 4 were staying on testing negative position for a shorter period time. This is because depending on the position of each hardpoint.
Note
- Reference cross check
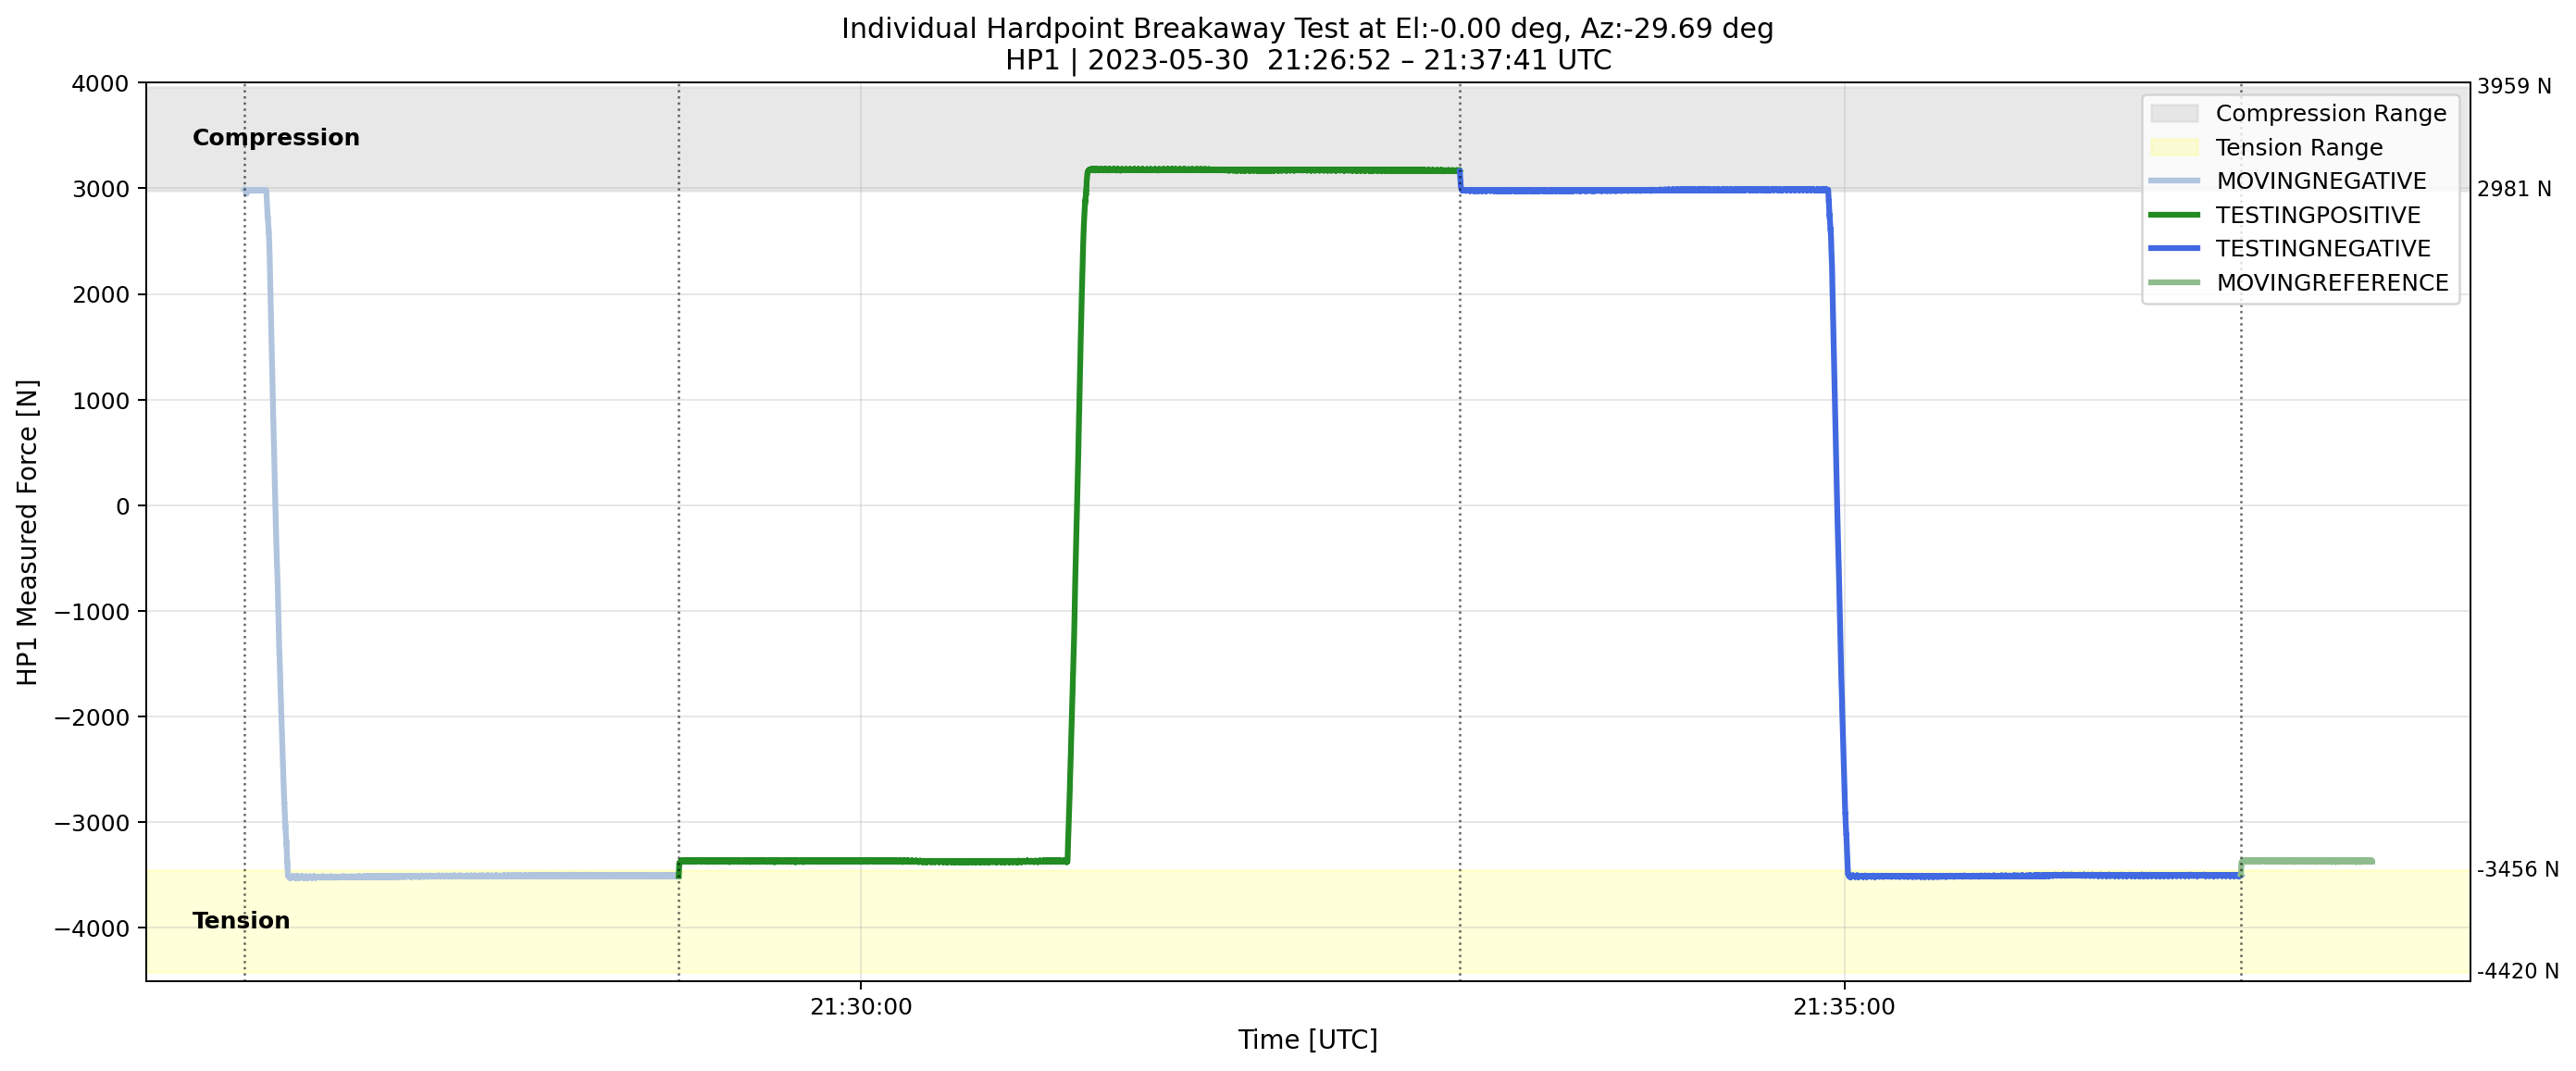
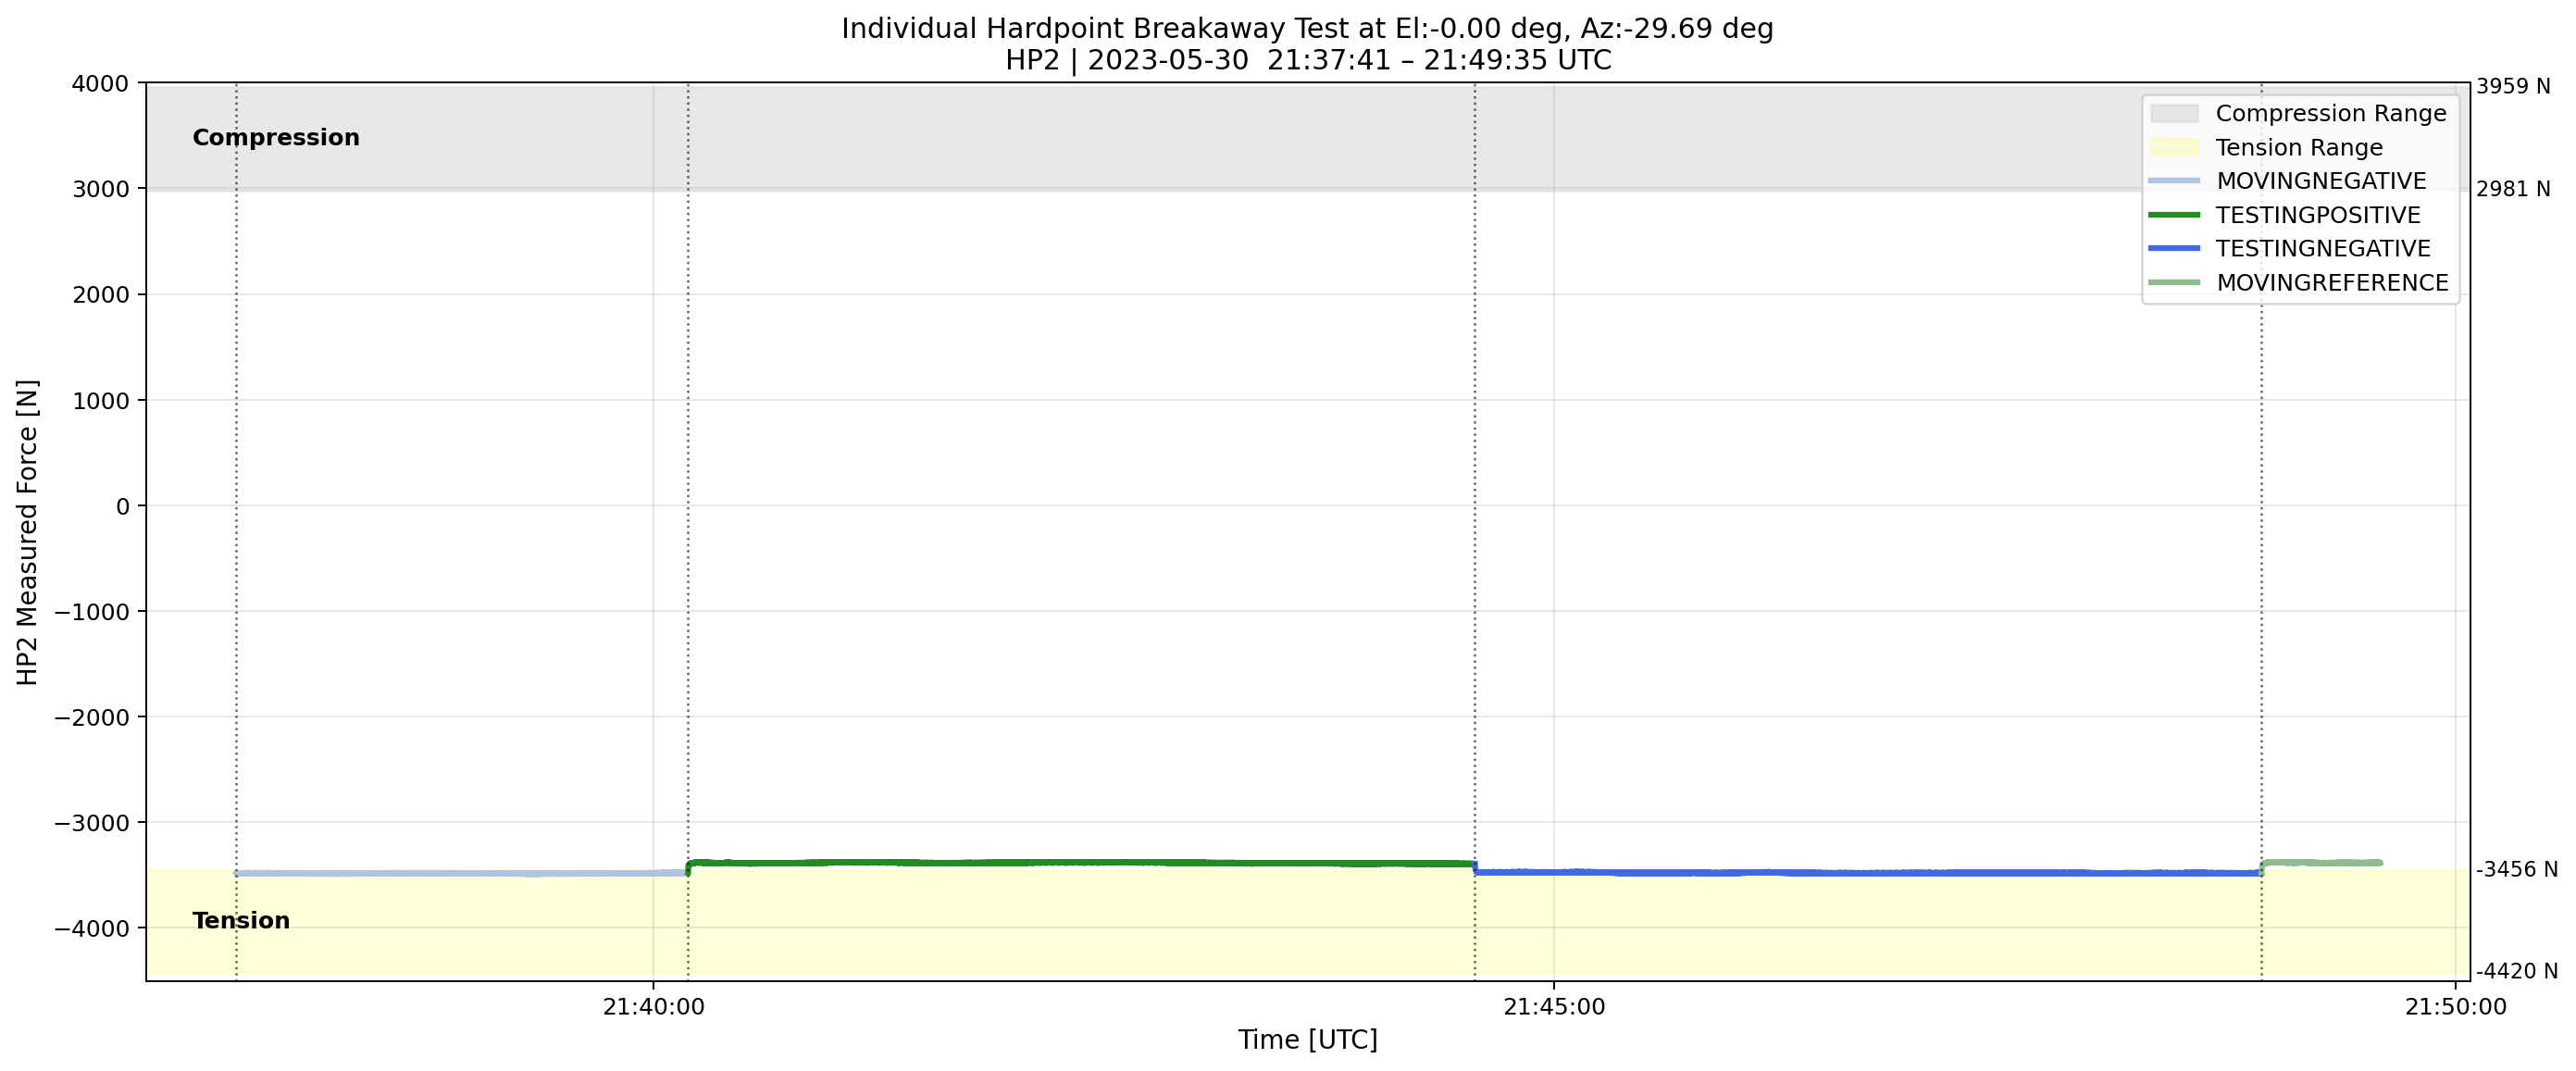
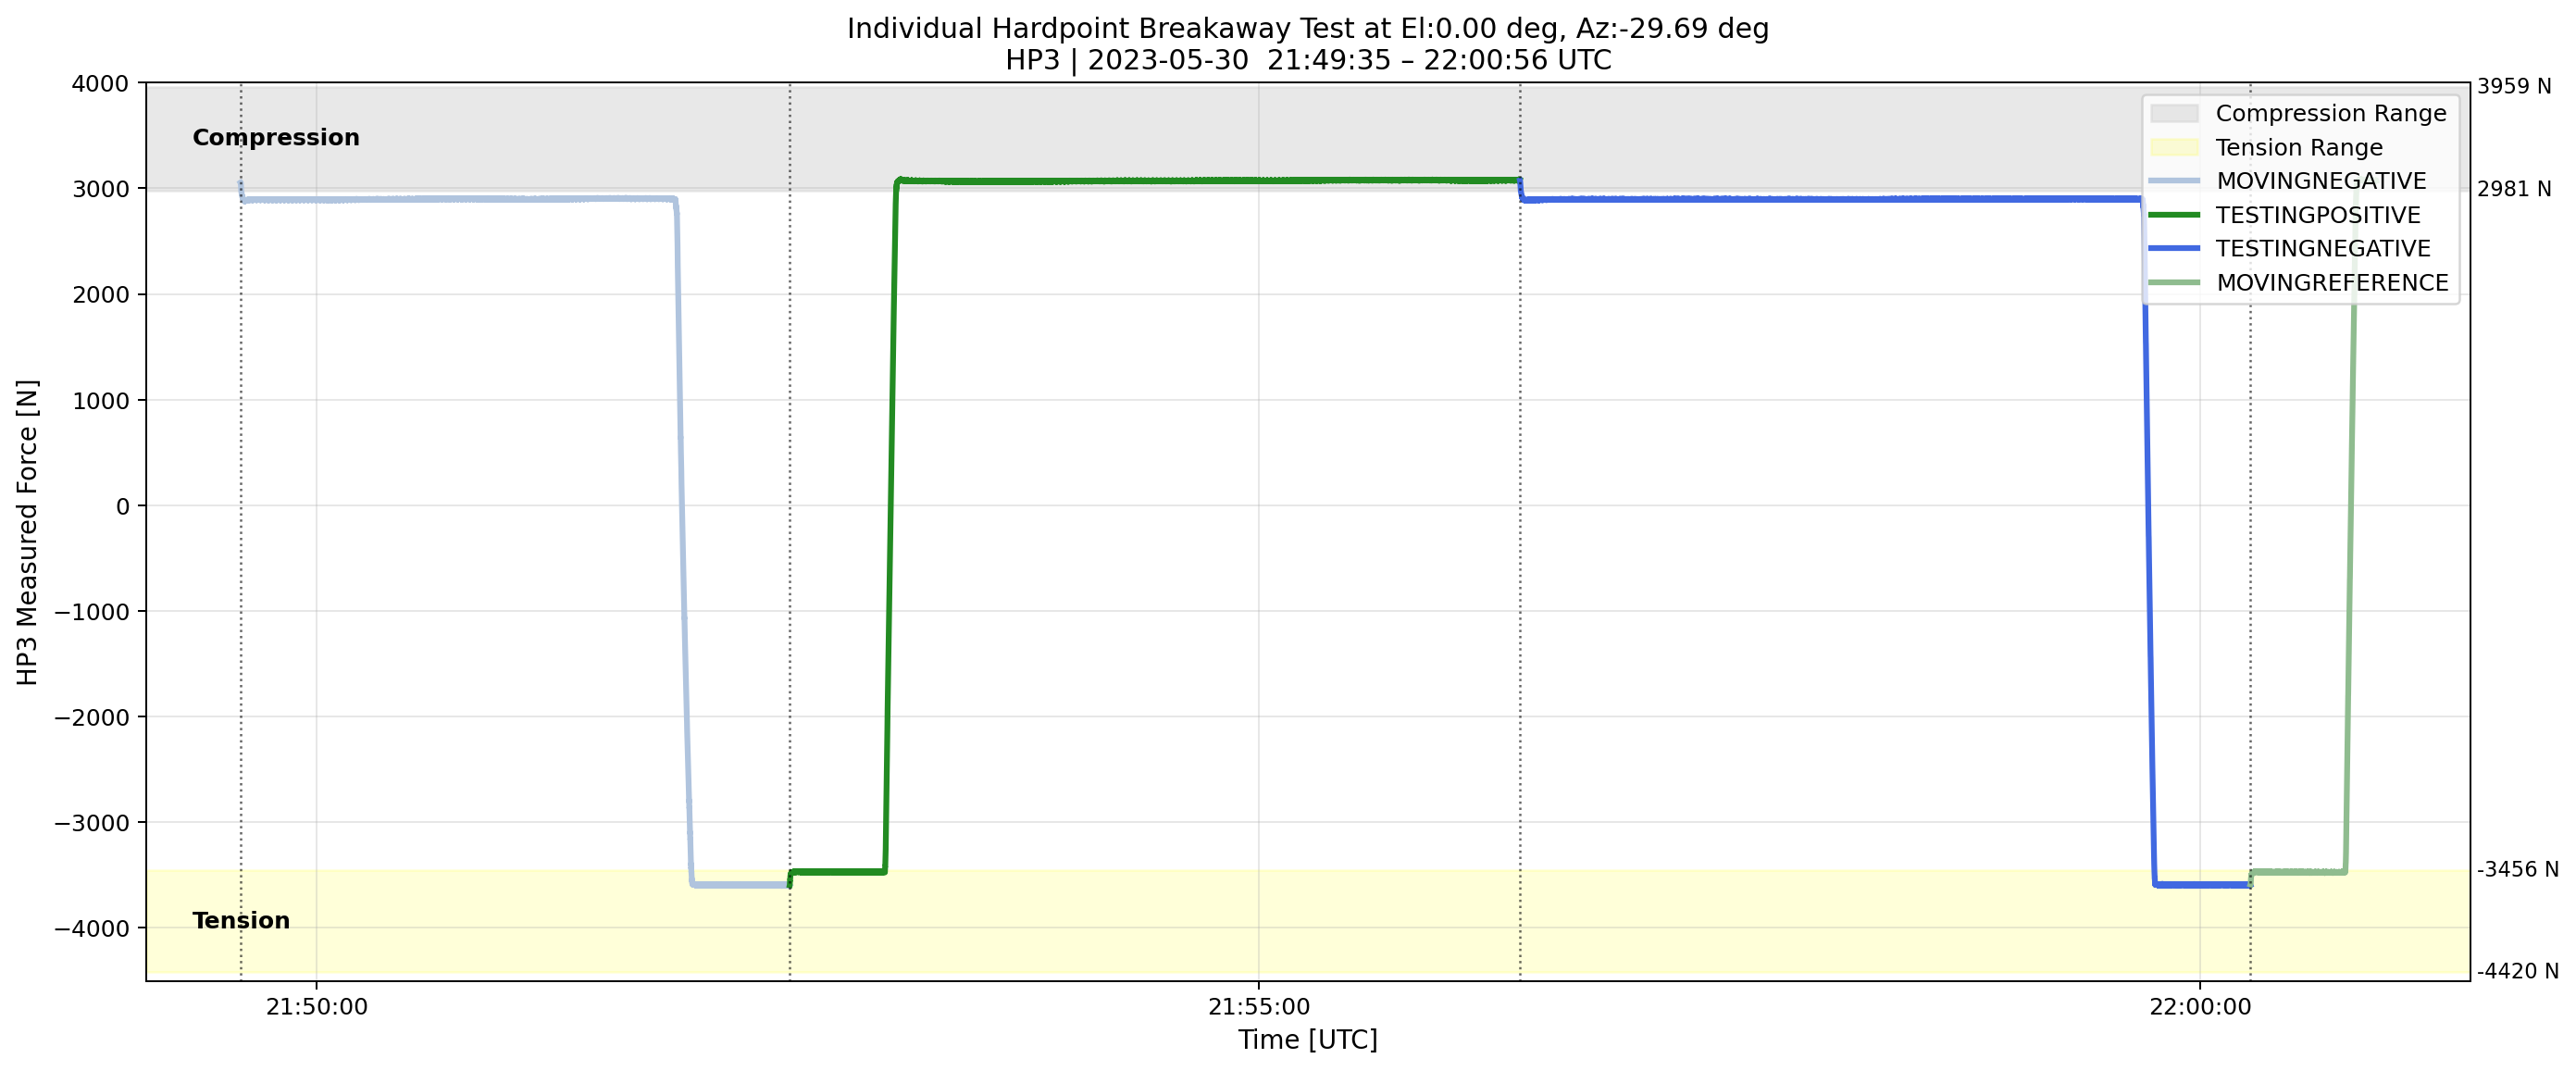
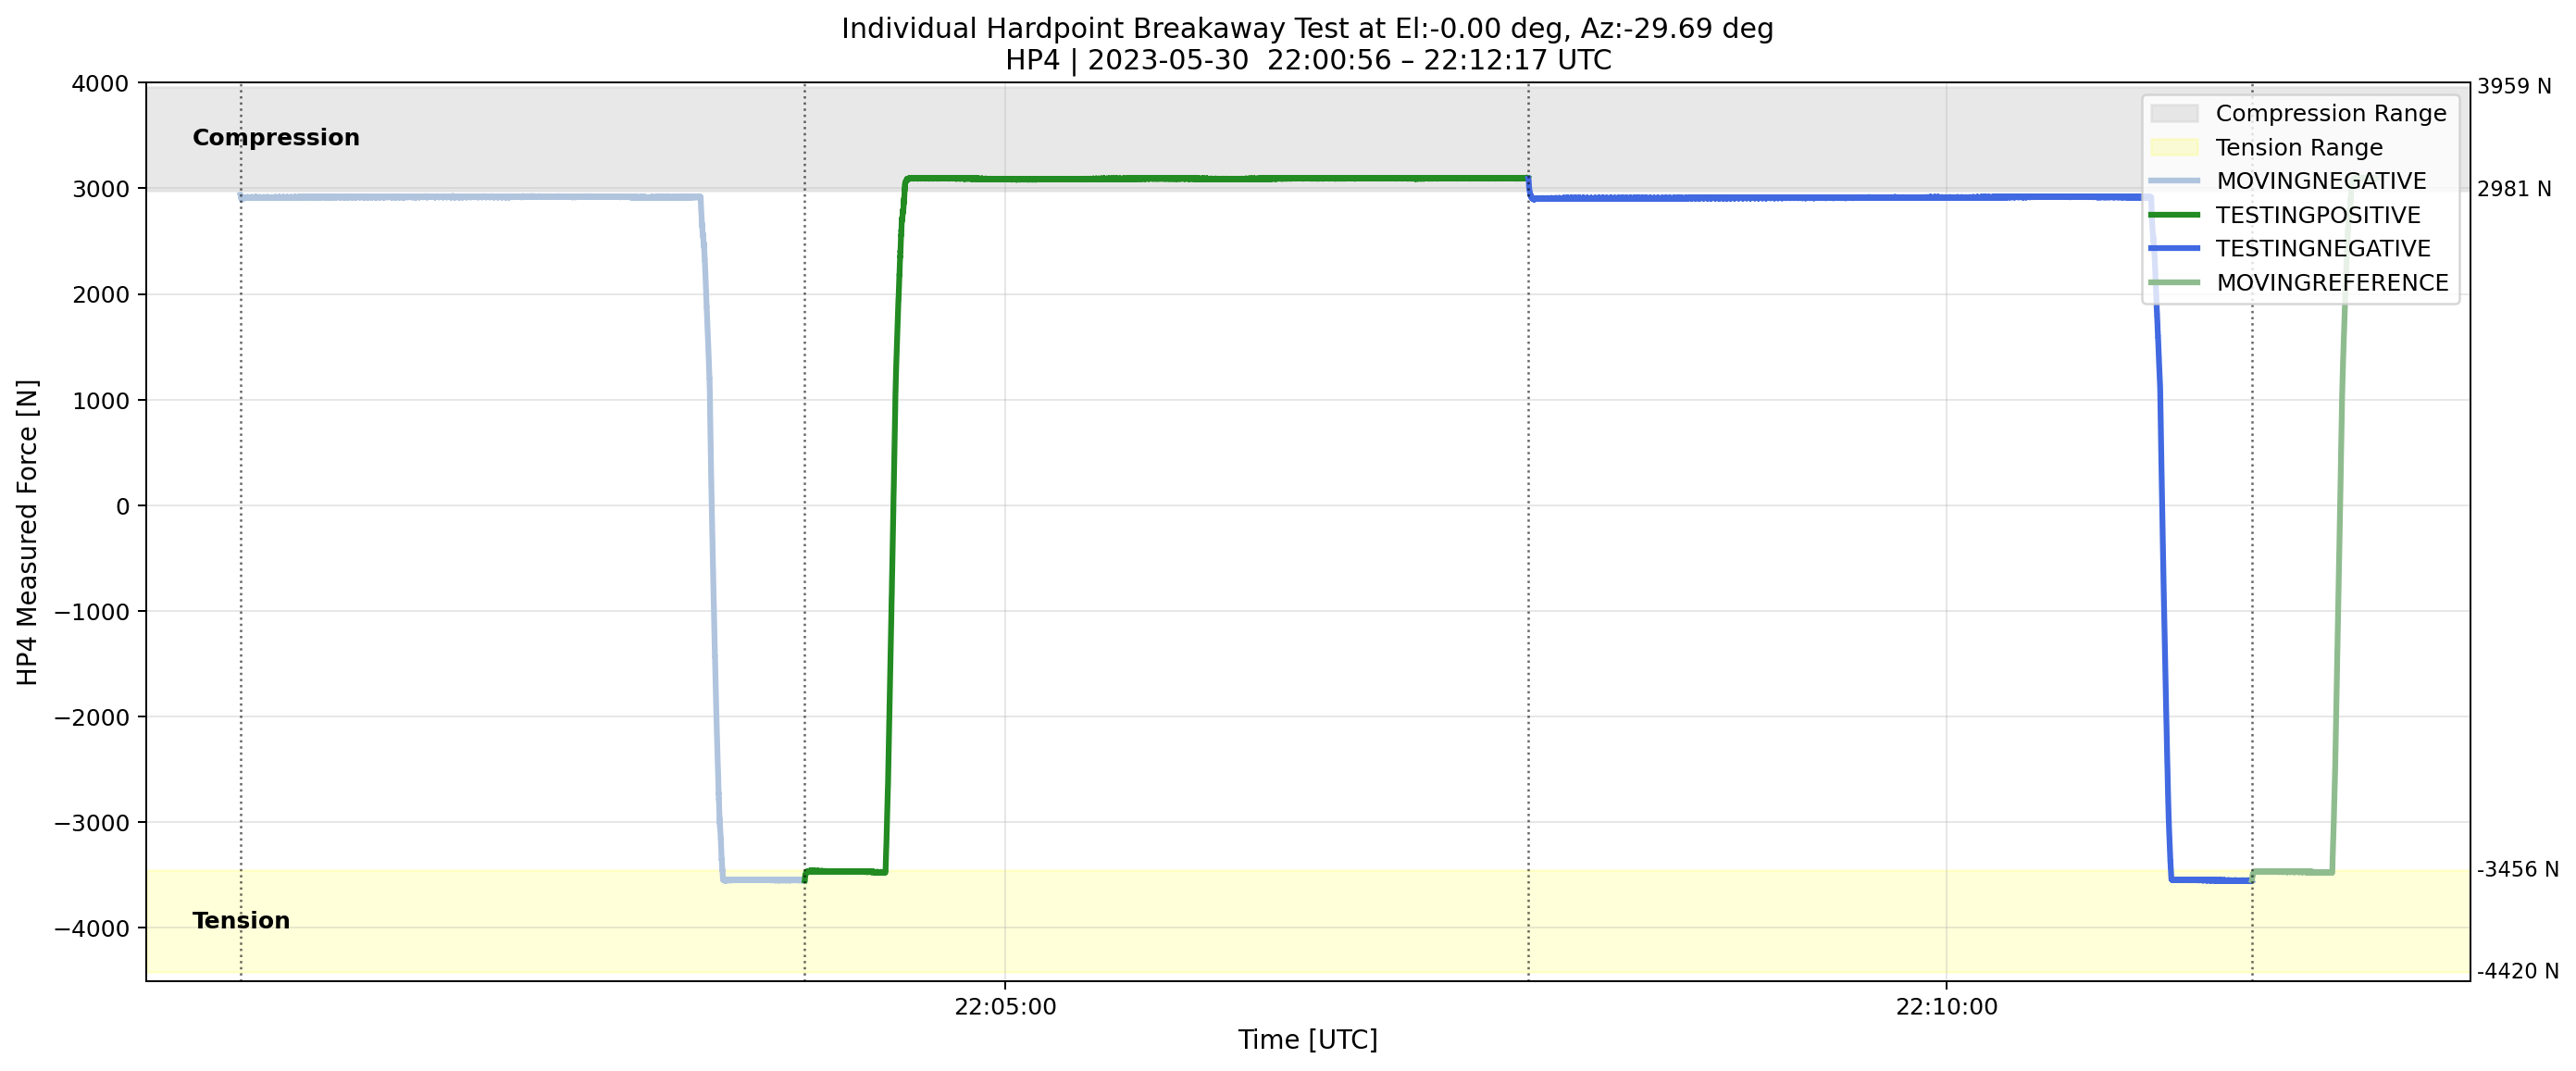
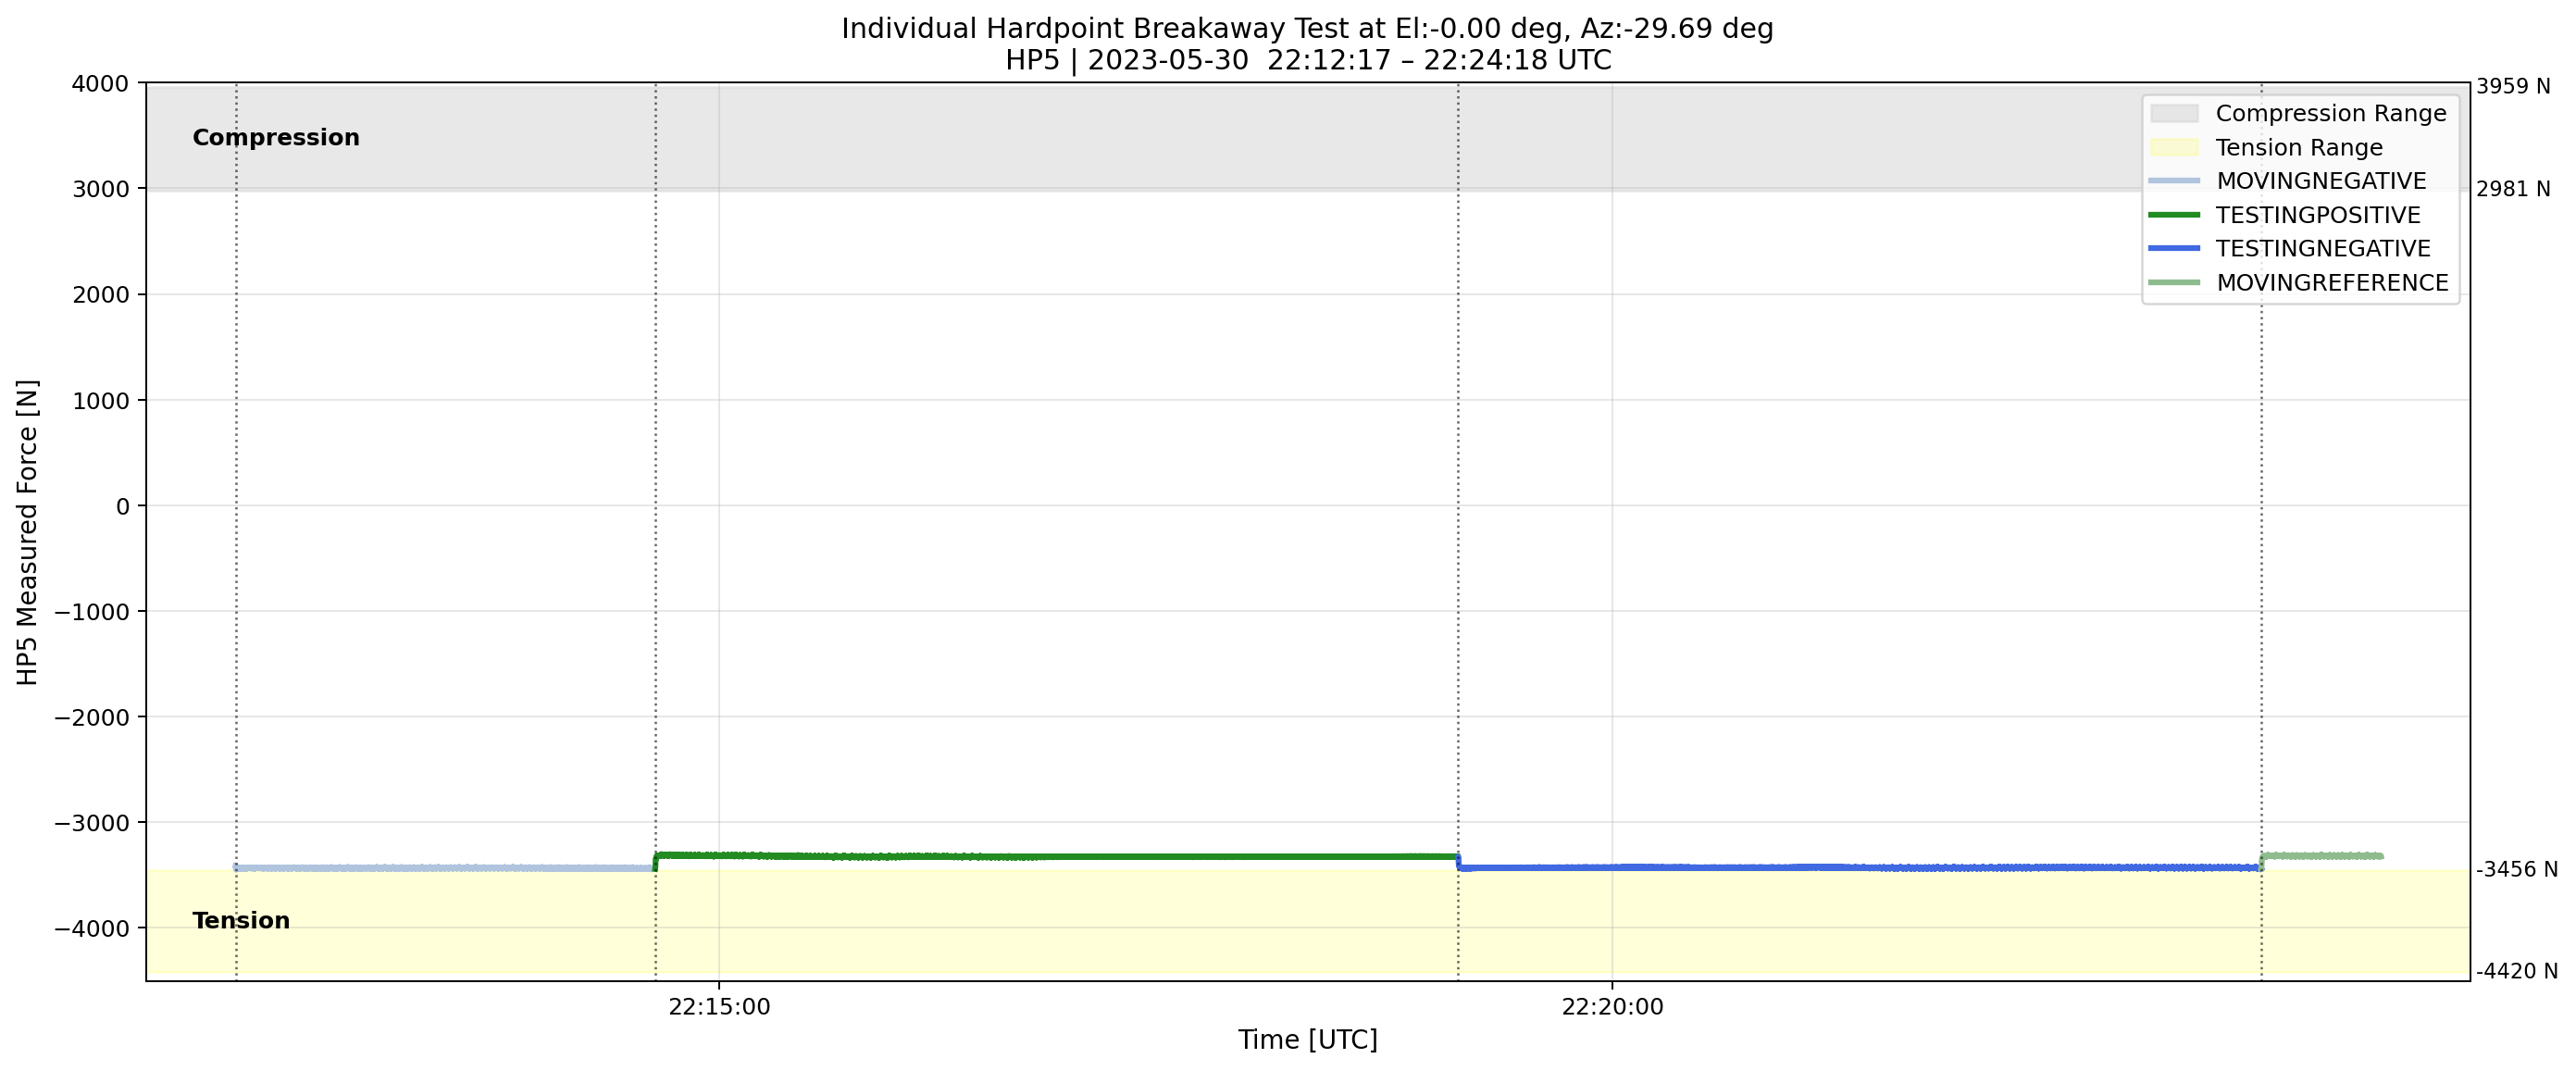
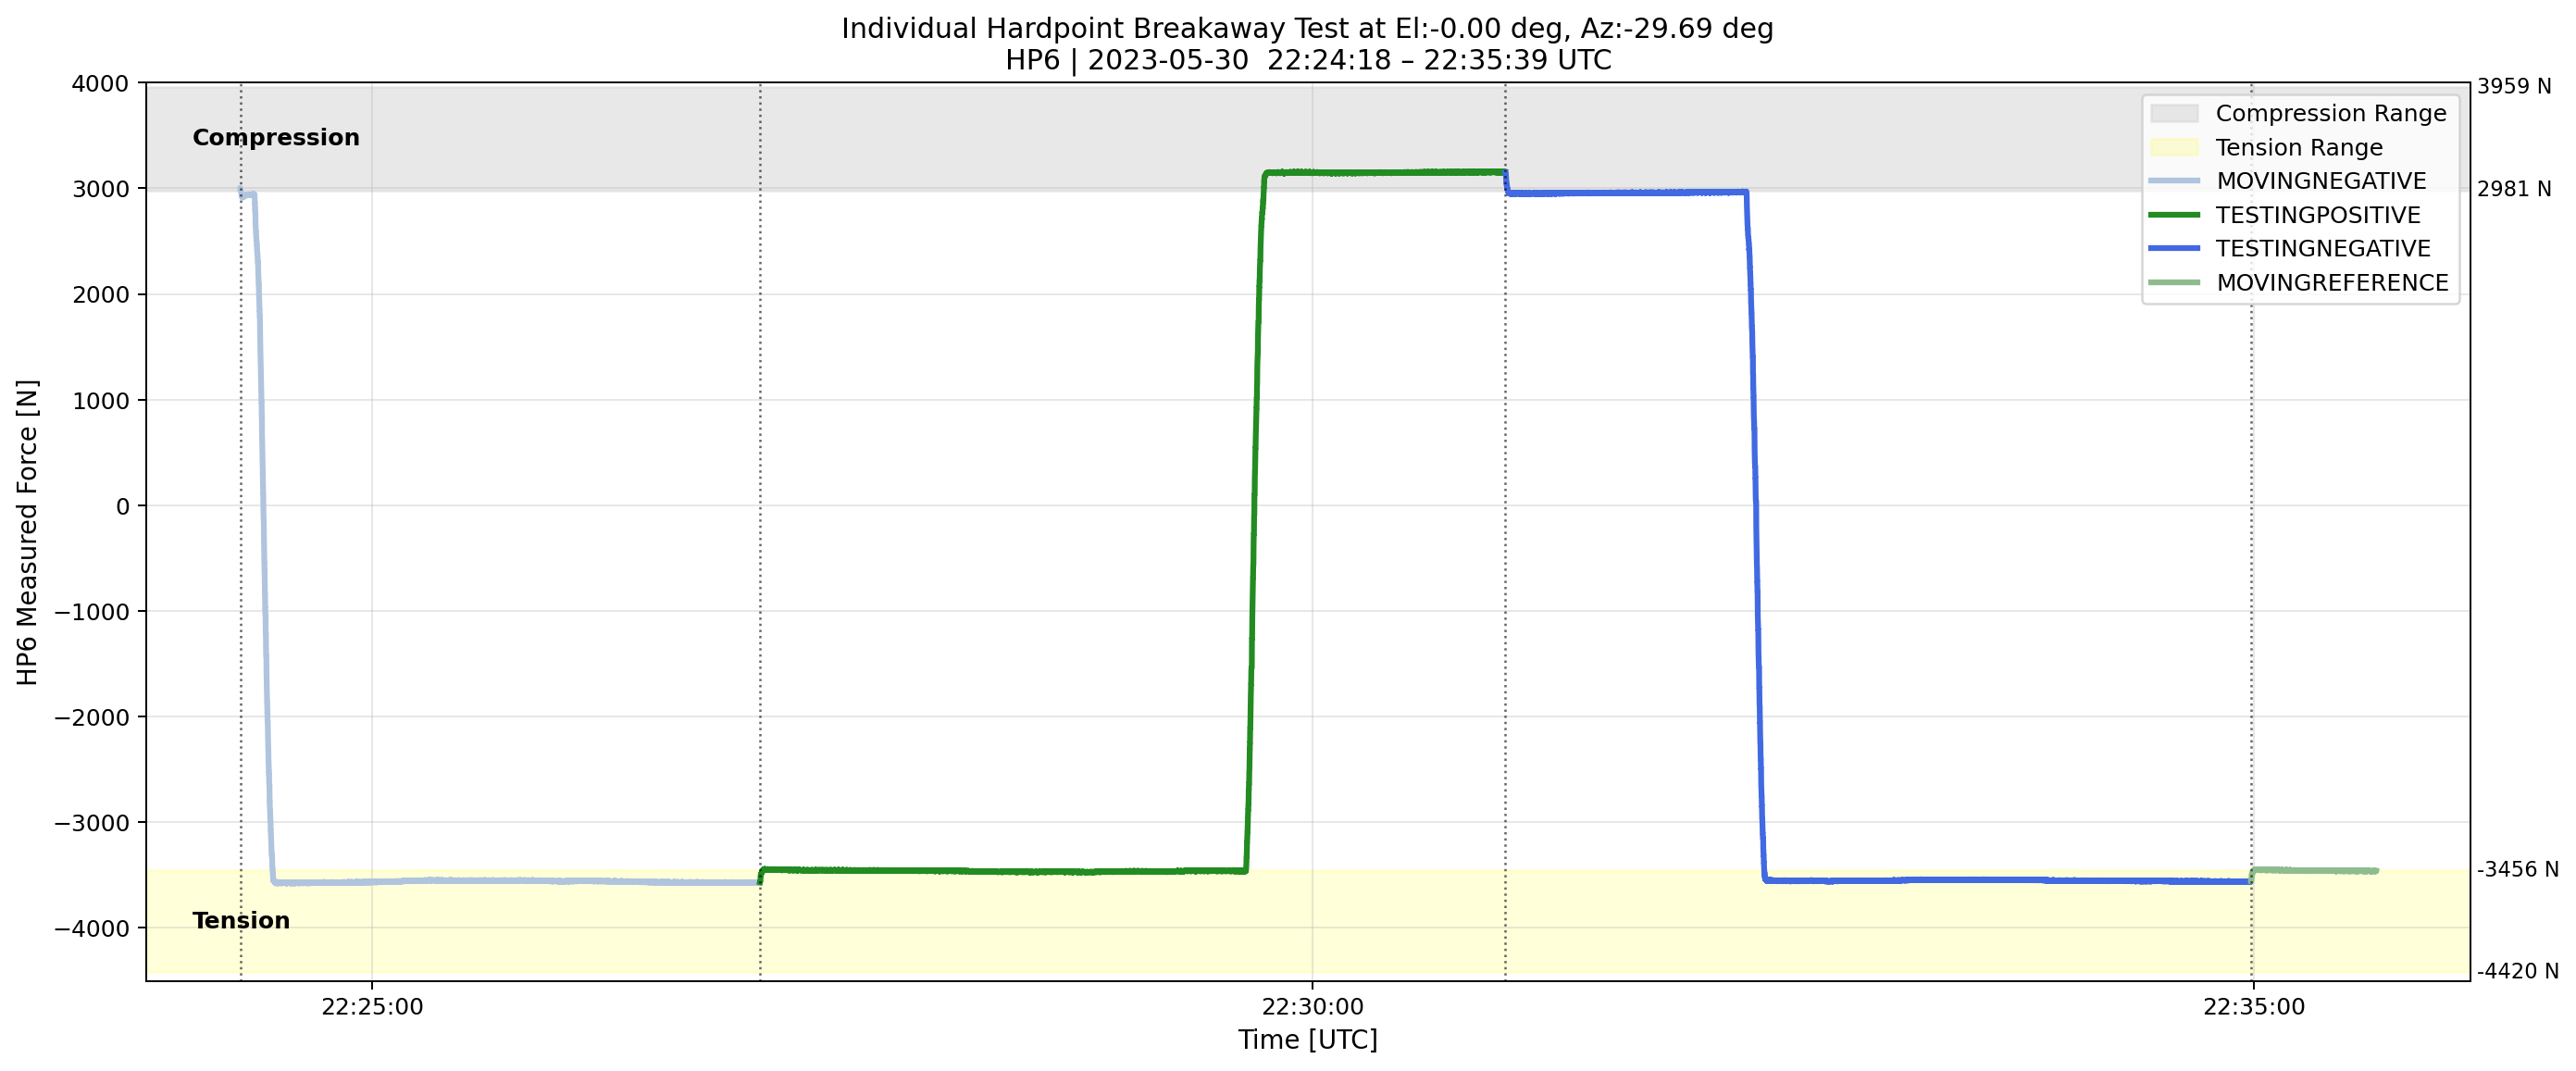
Fig. 4 Transition of the measured forces on each hardpoint when the TMA is at el=0deg.#
The stiffness of each curves are fitted from \(\Delta\)displacement = 0 \({\mu}m\) (Figure 5).
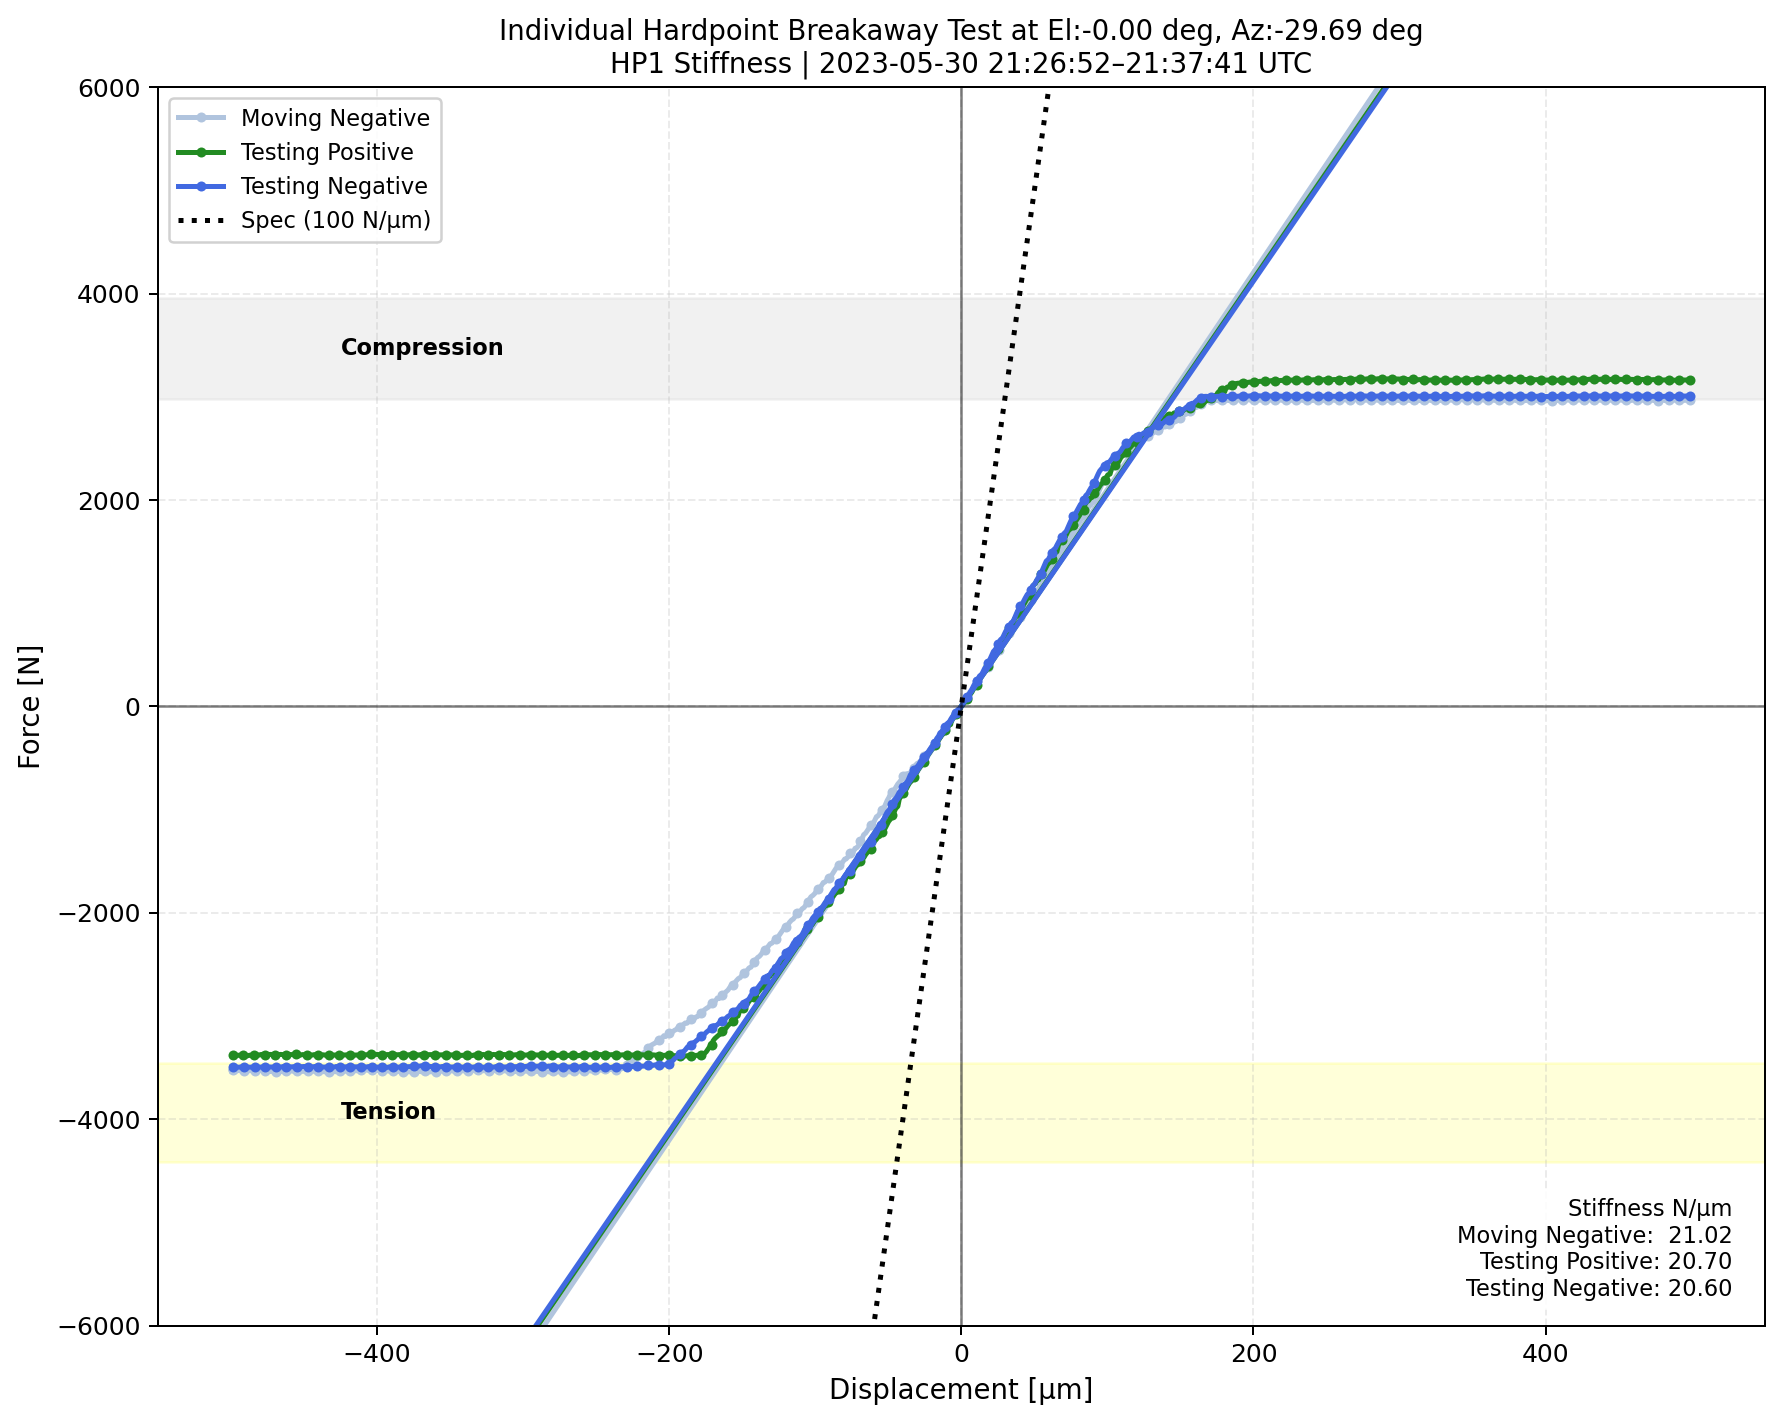
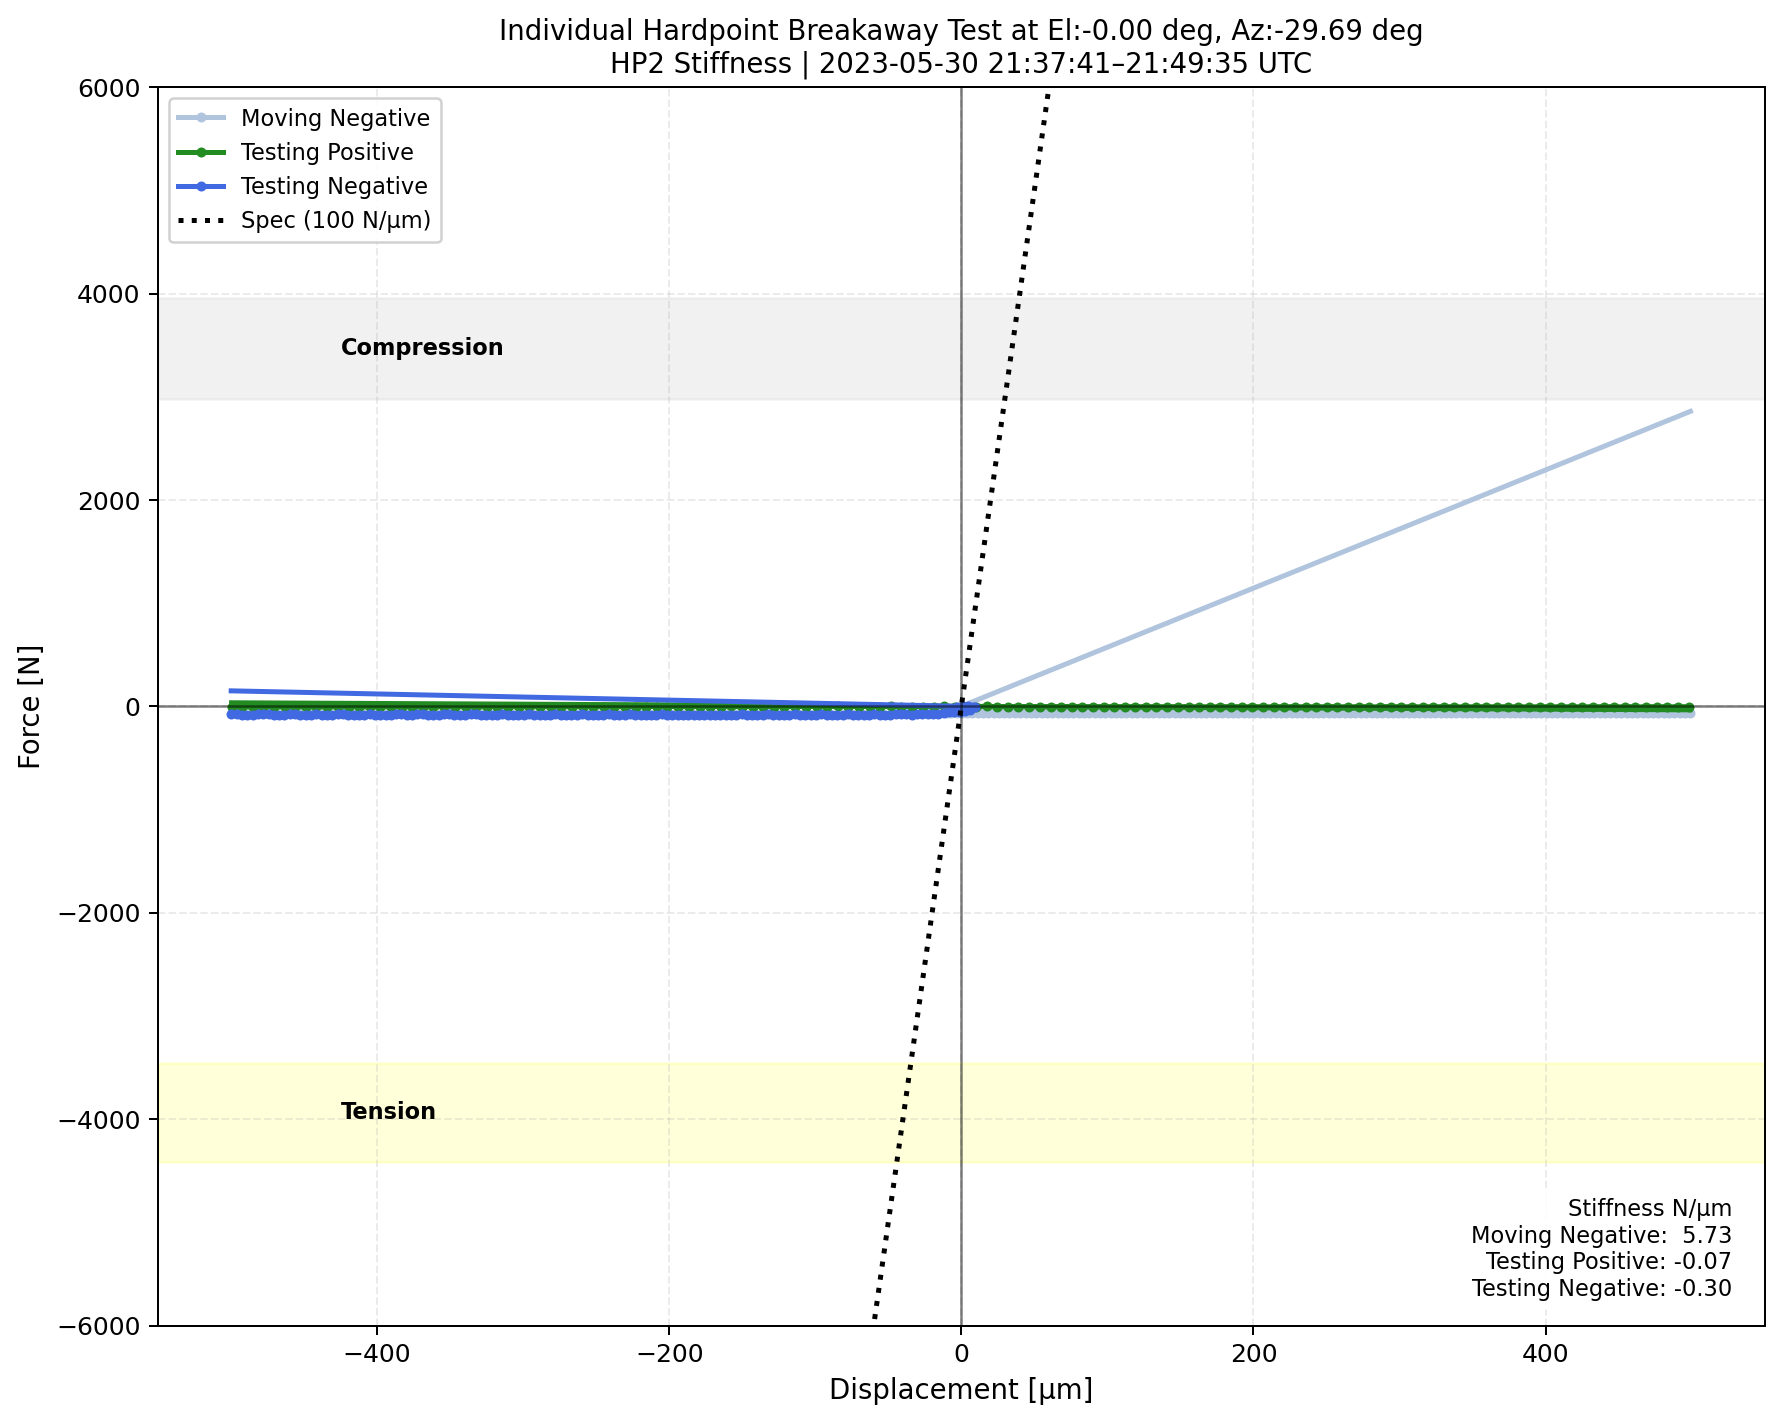


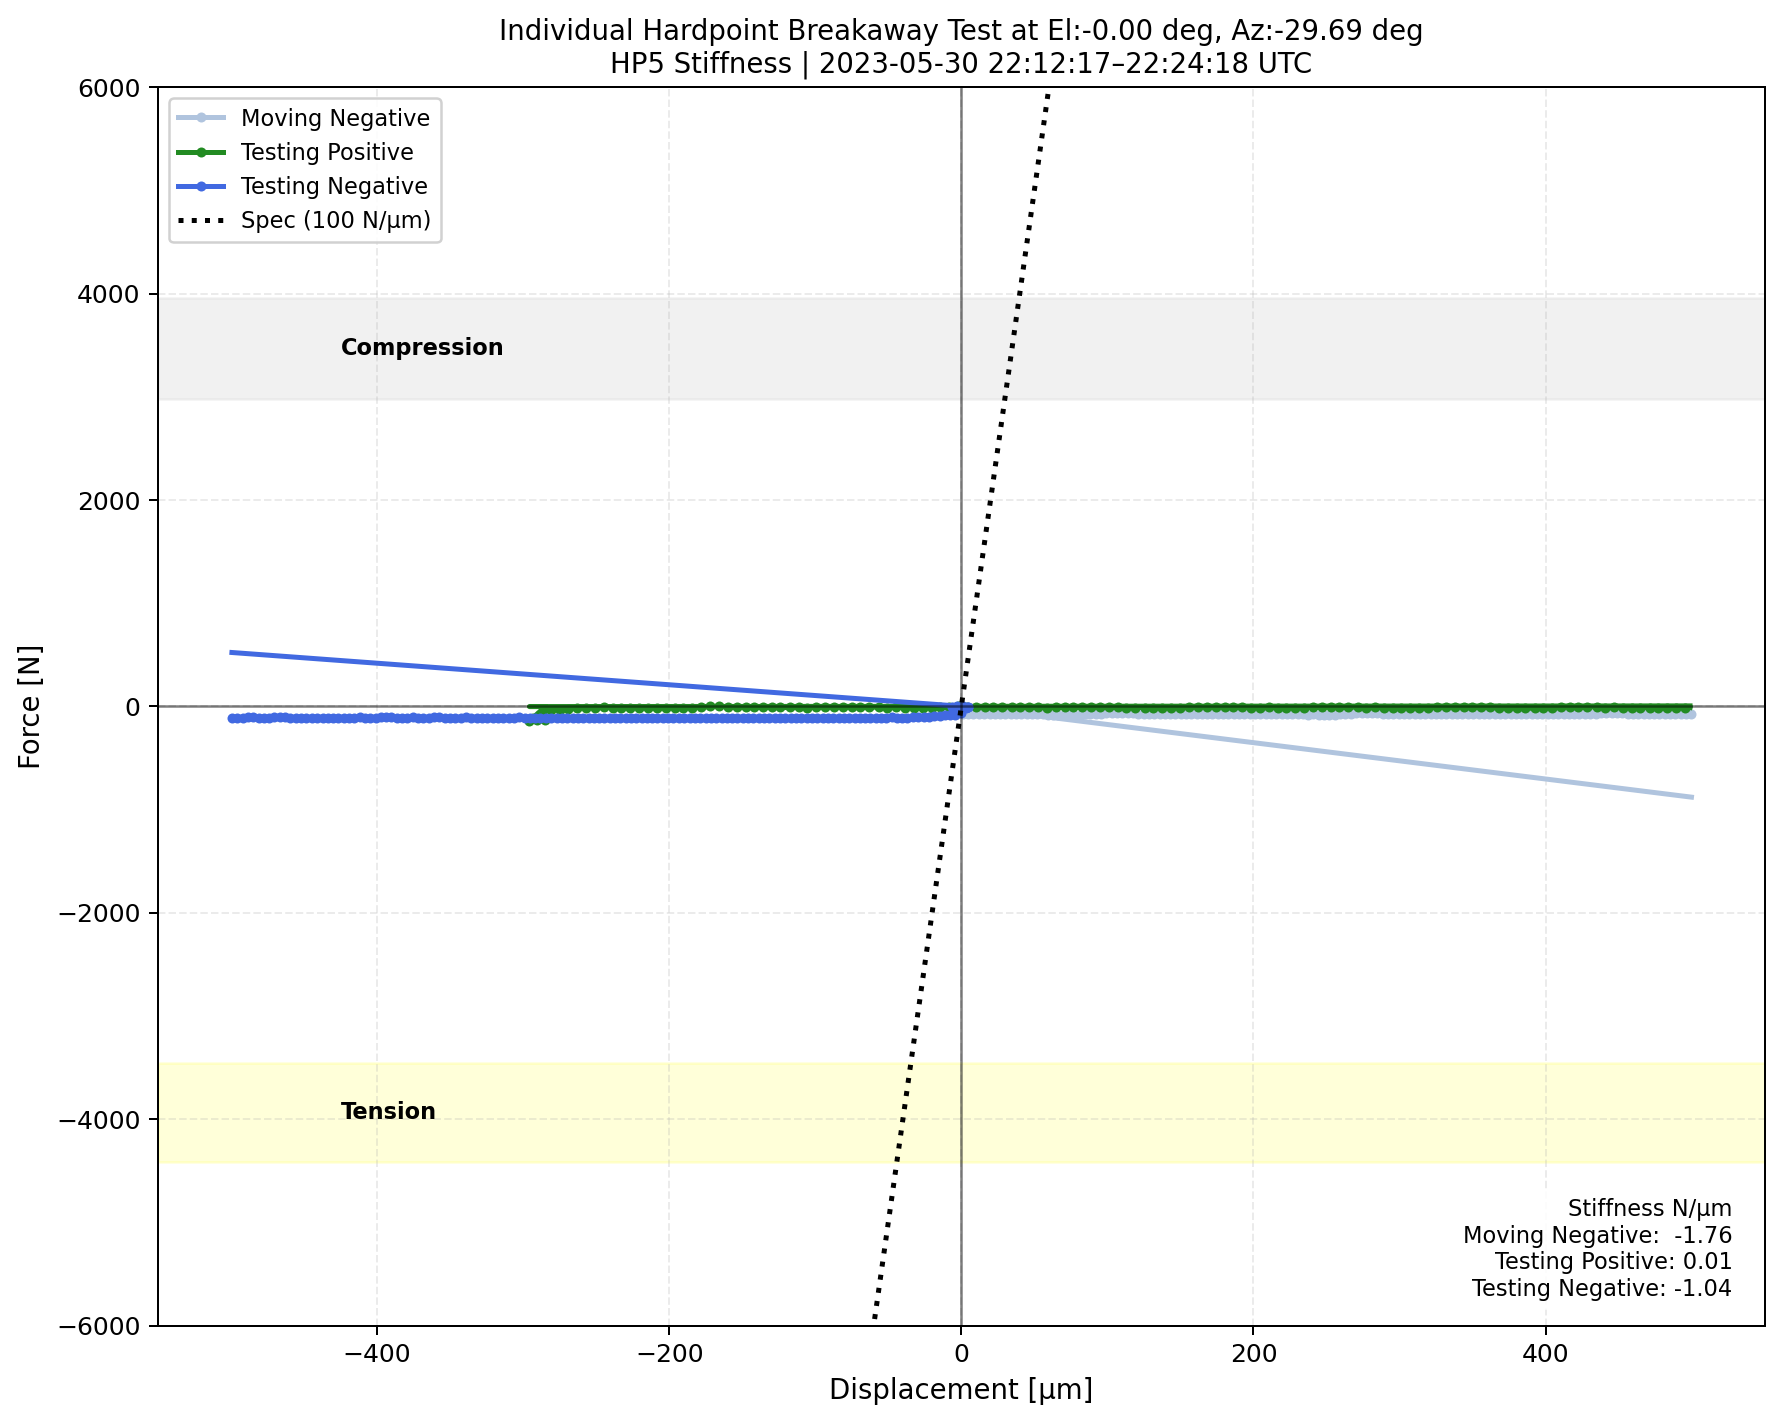
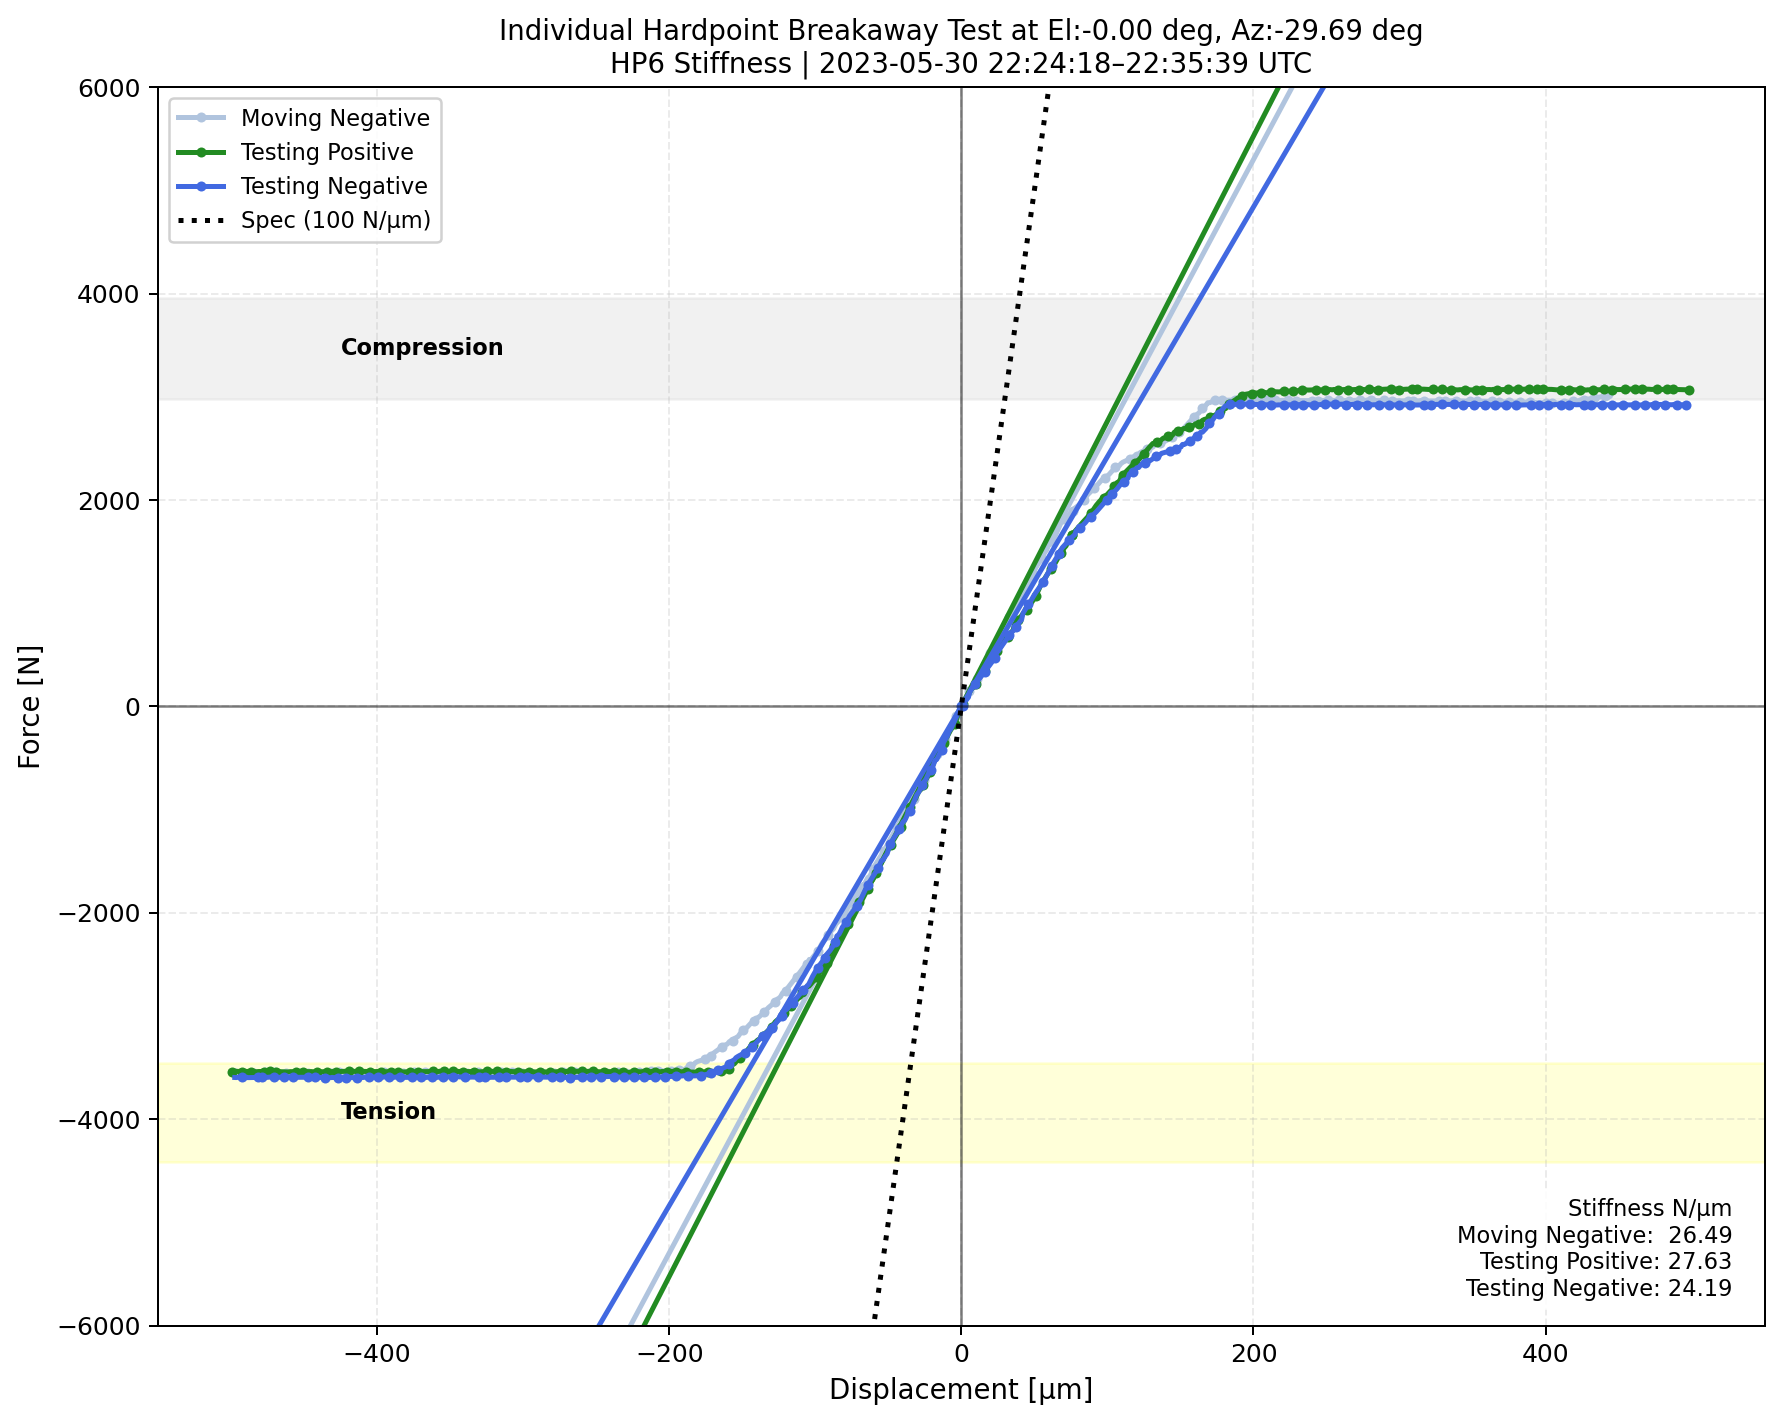
Fig. 5 <math>\Delta</math>Displacement versus measured forces for each phase during the hardpoint breakaway test when the TMA is at el=0deg.#


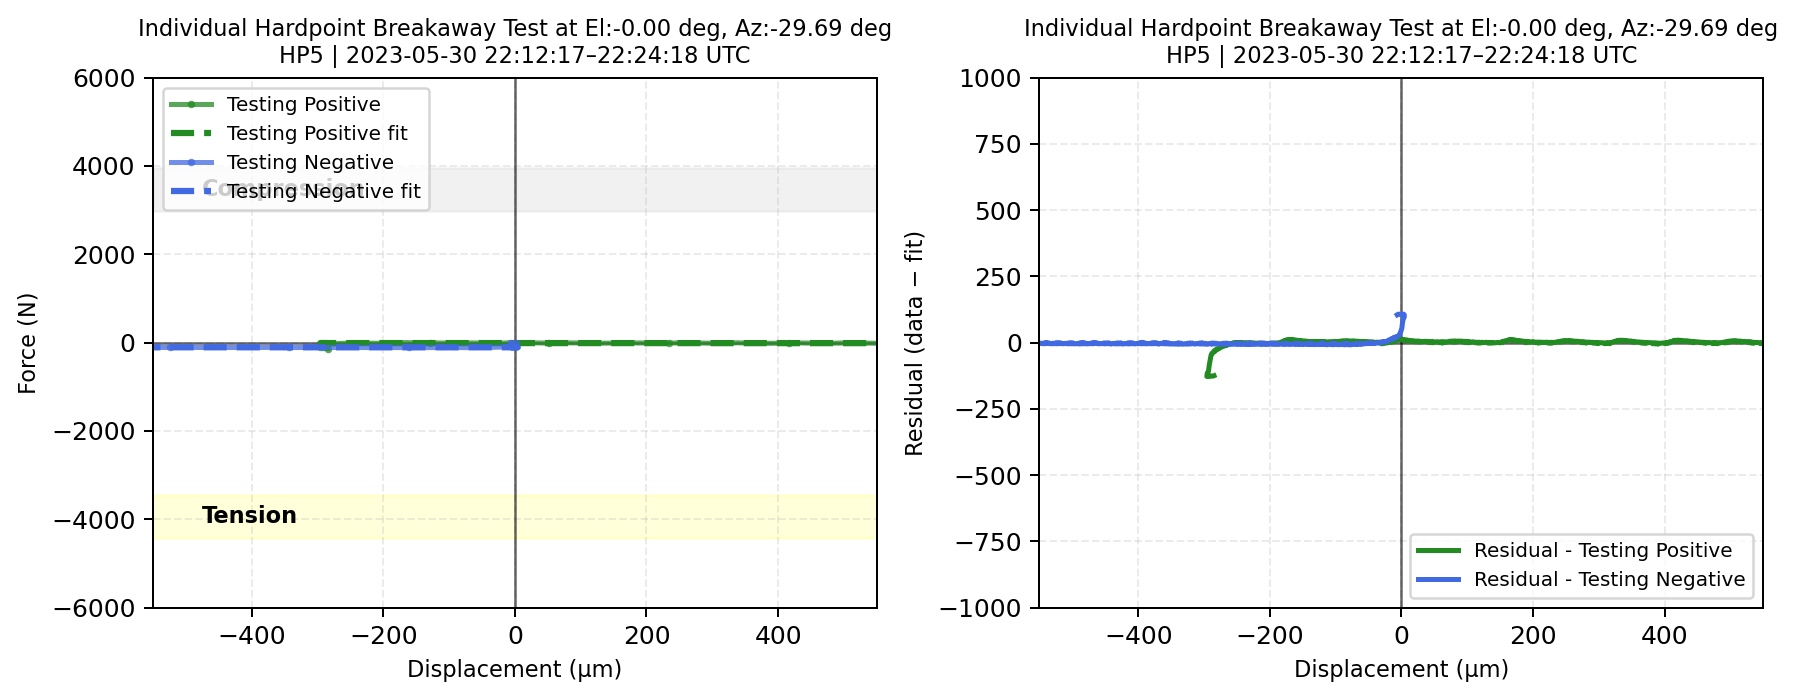
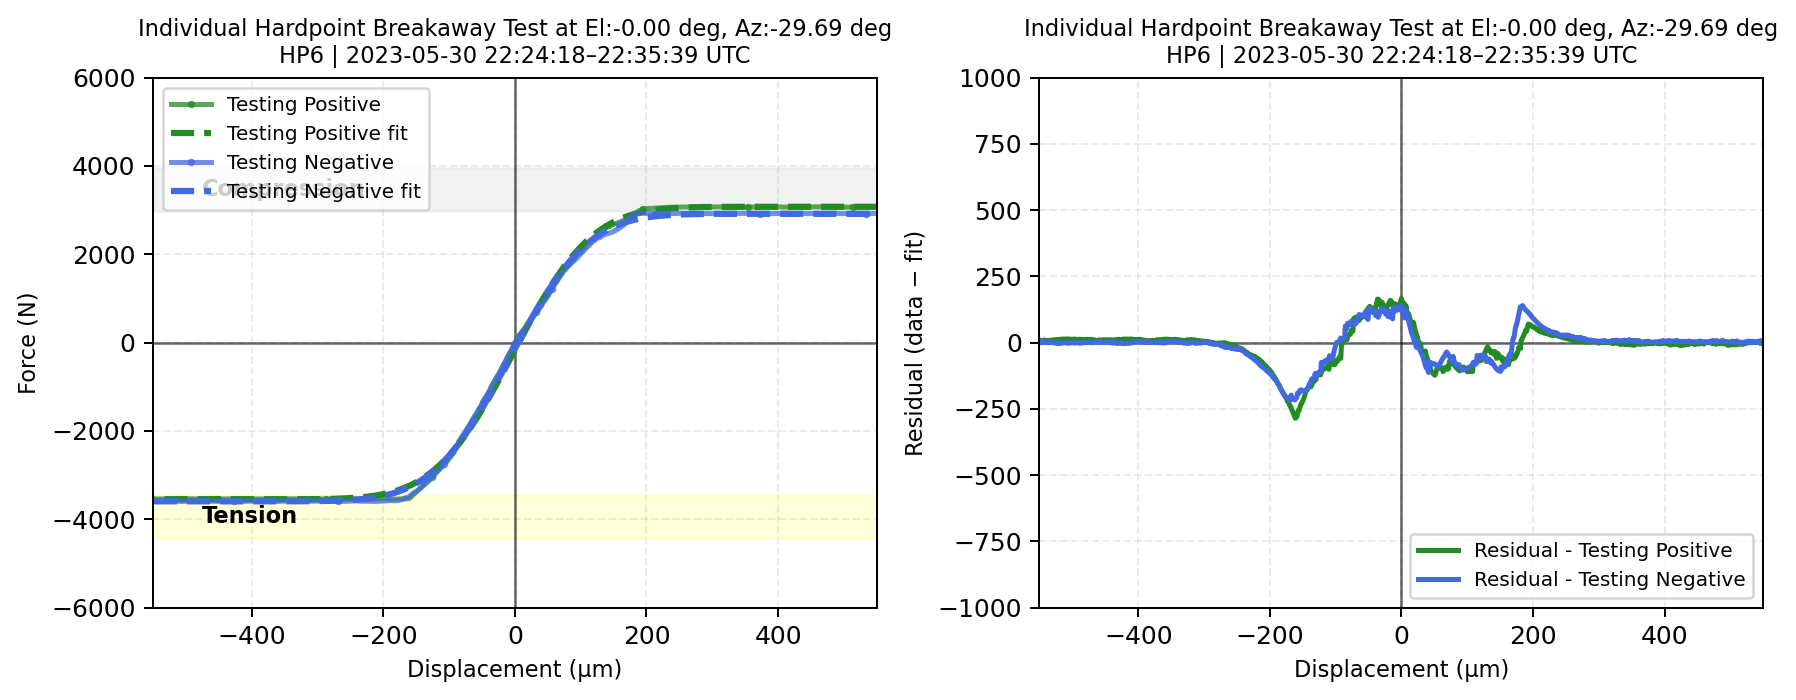
Fig. 6 (Left) \(\Delta\)Displacement versus measured forces for each phase during the hardpoint breakaway test fit with error function (the TMA at el=0deg). (Right) The residual, a difference between data and error function, with respect to \(\Delta\)displacement#
HP Test at el 40 deg#
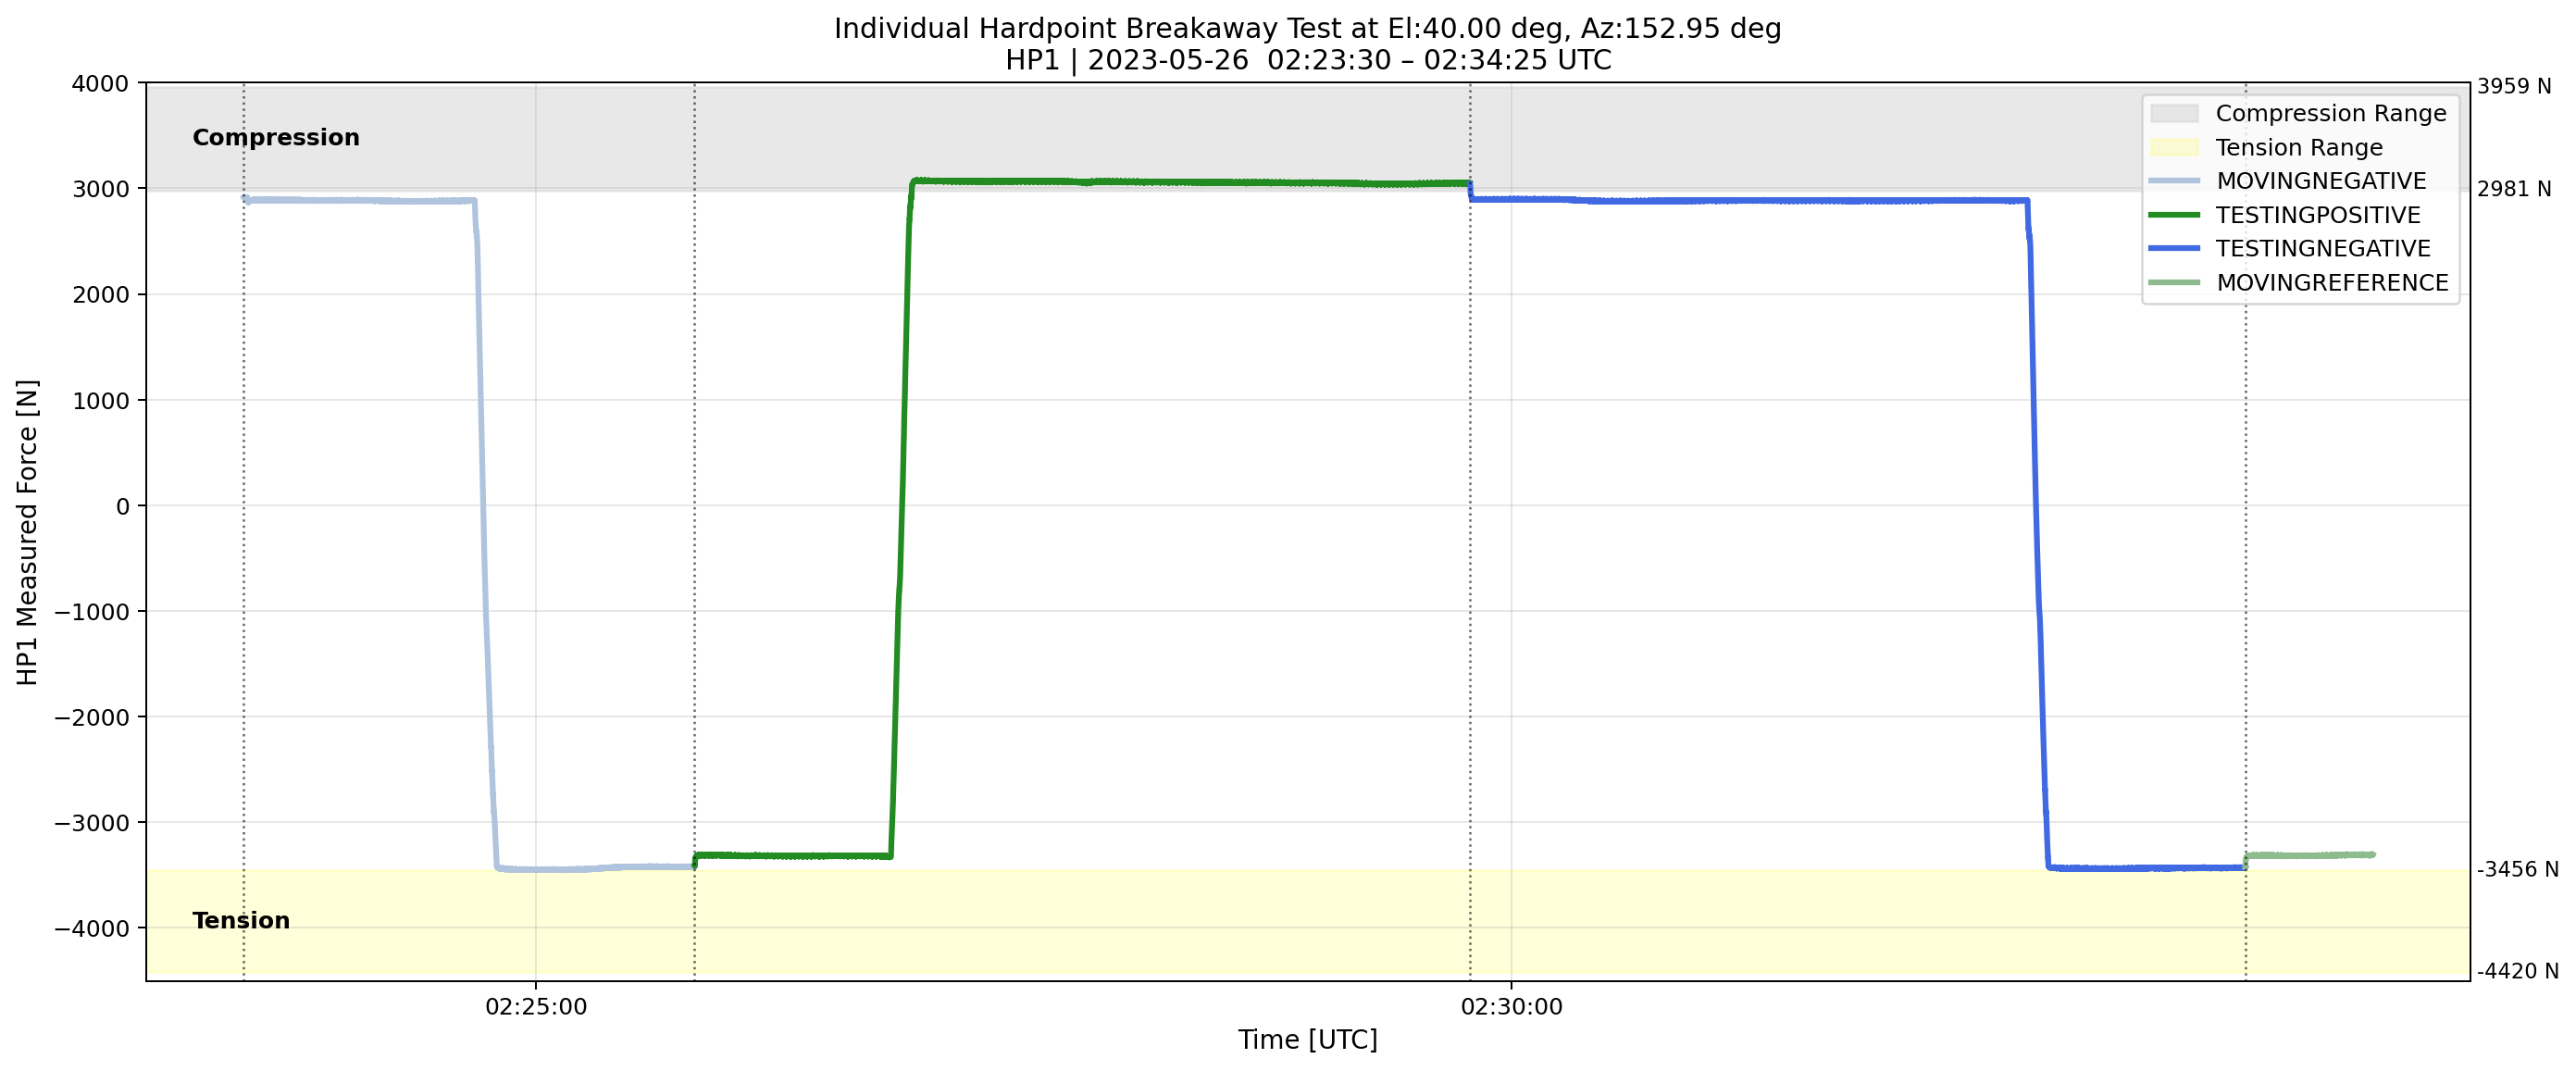
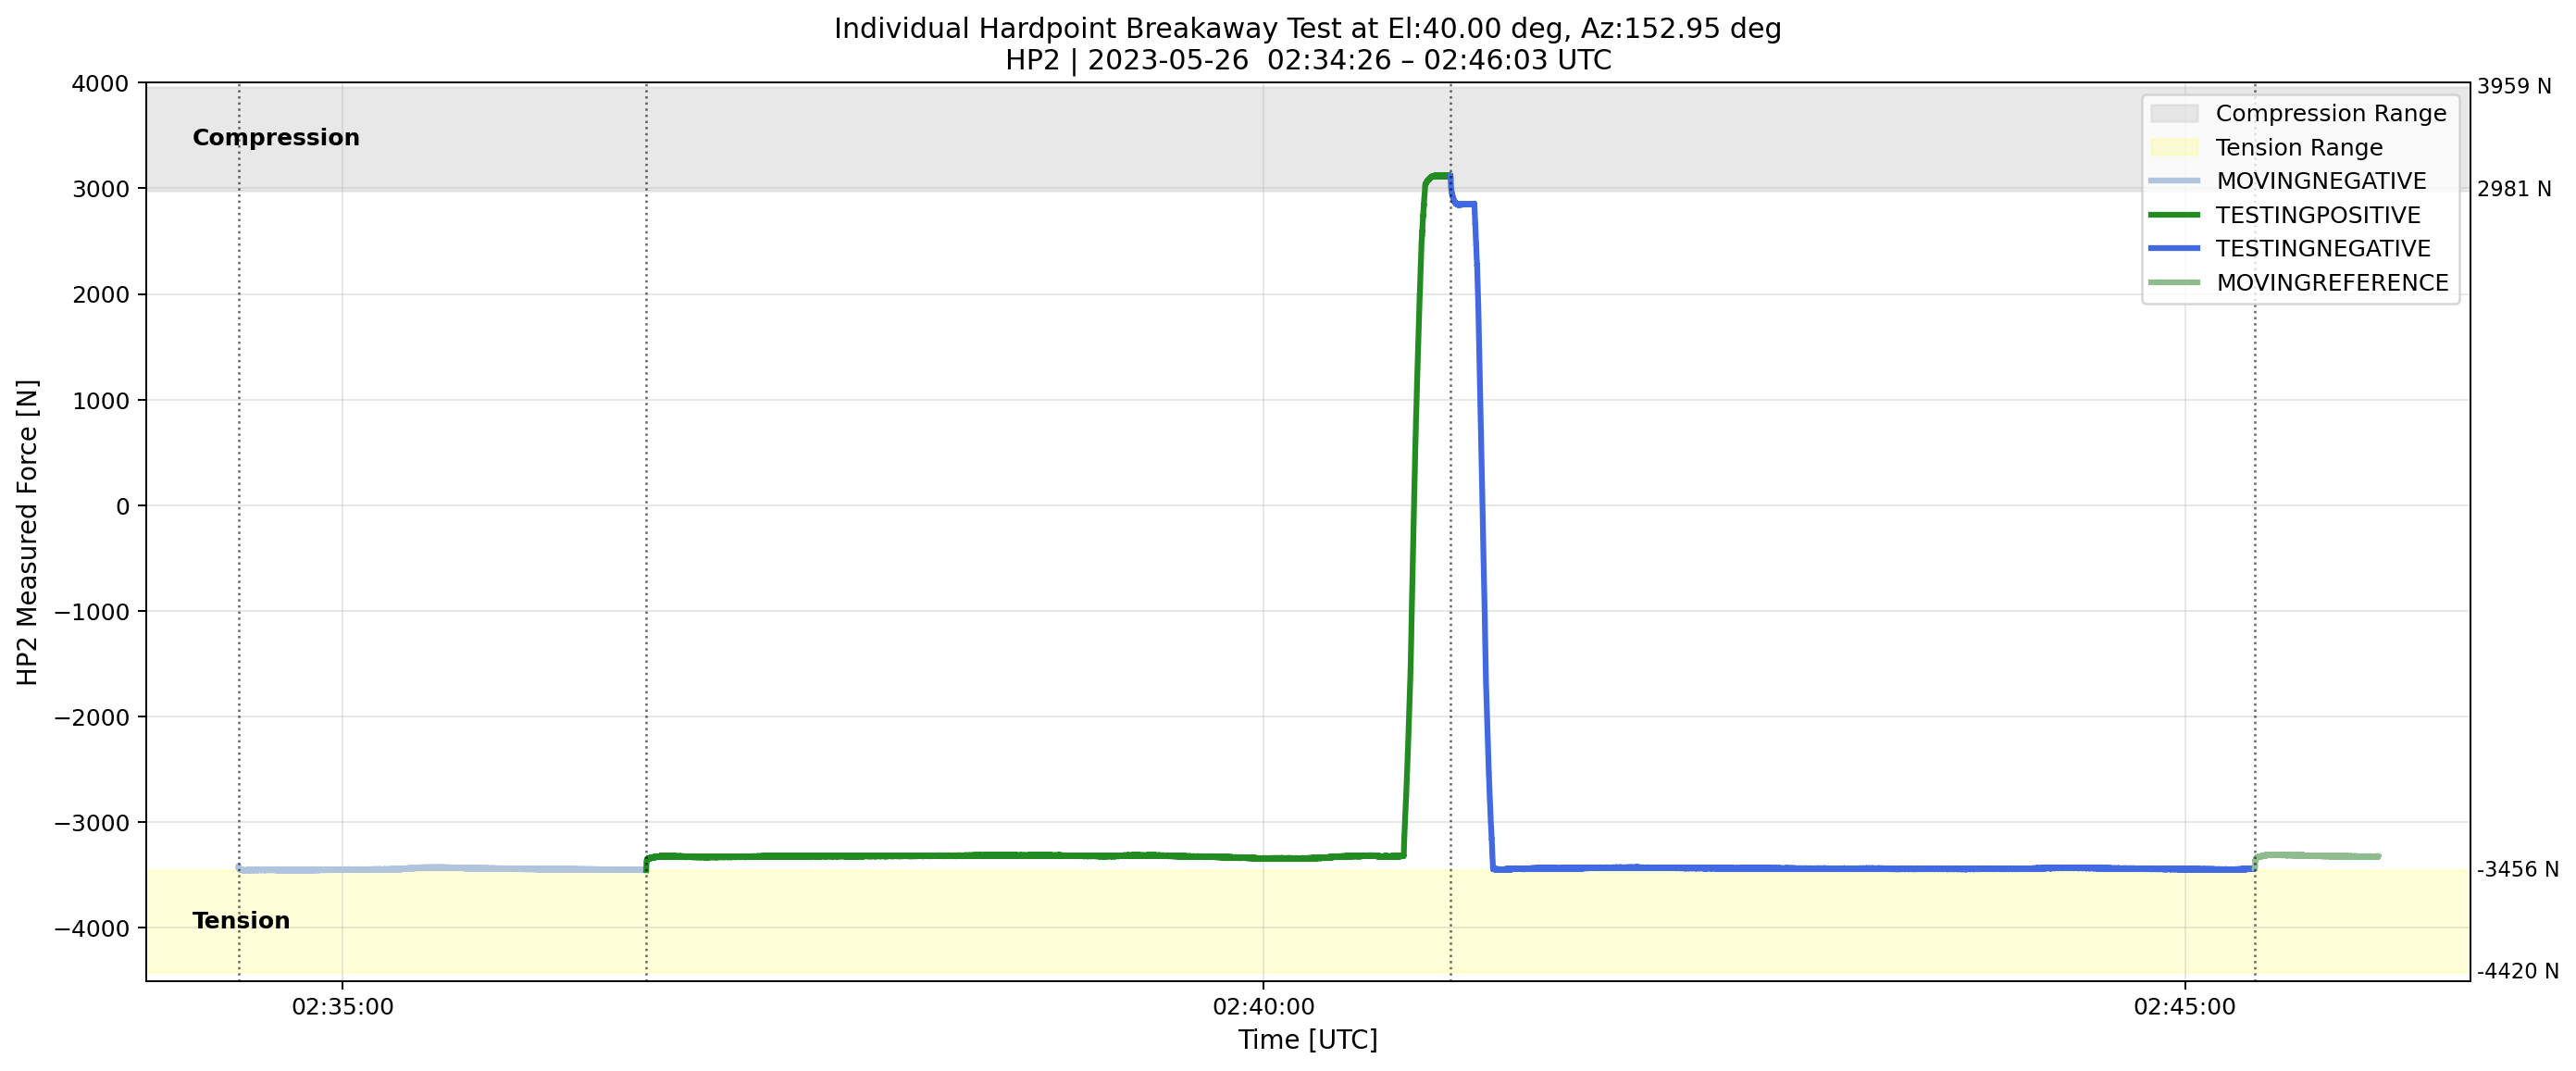
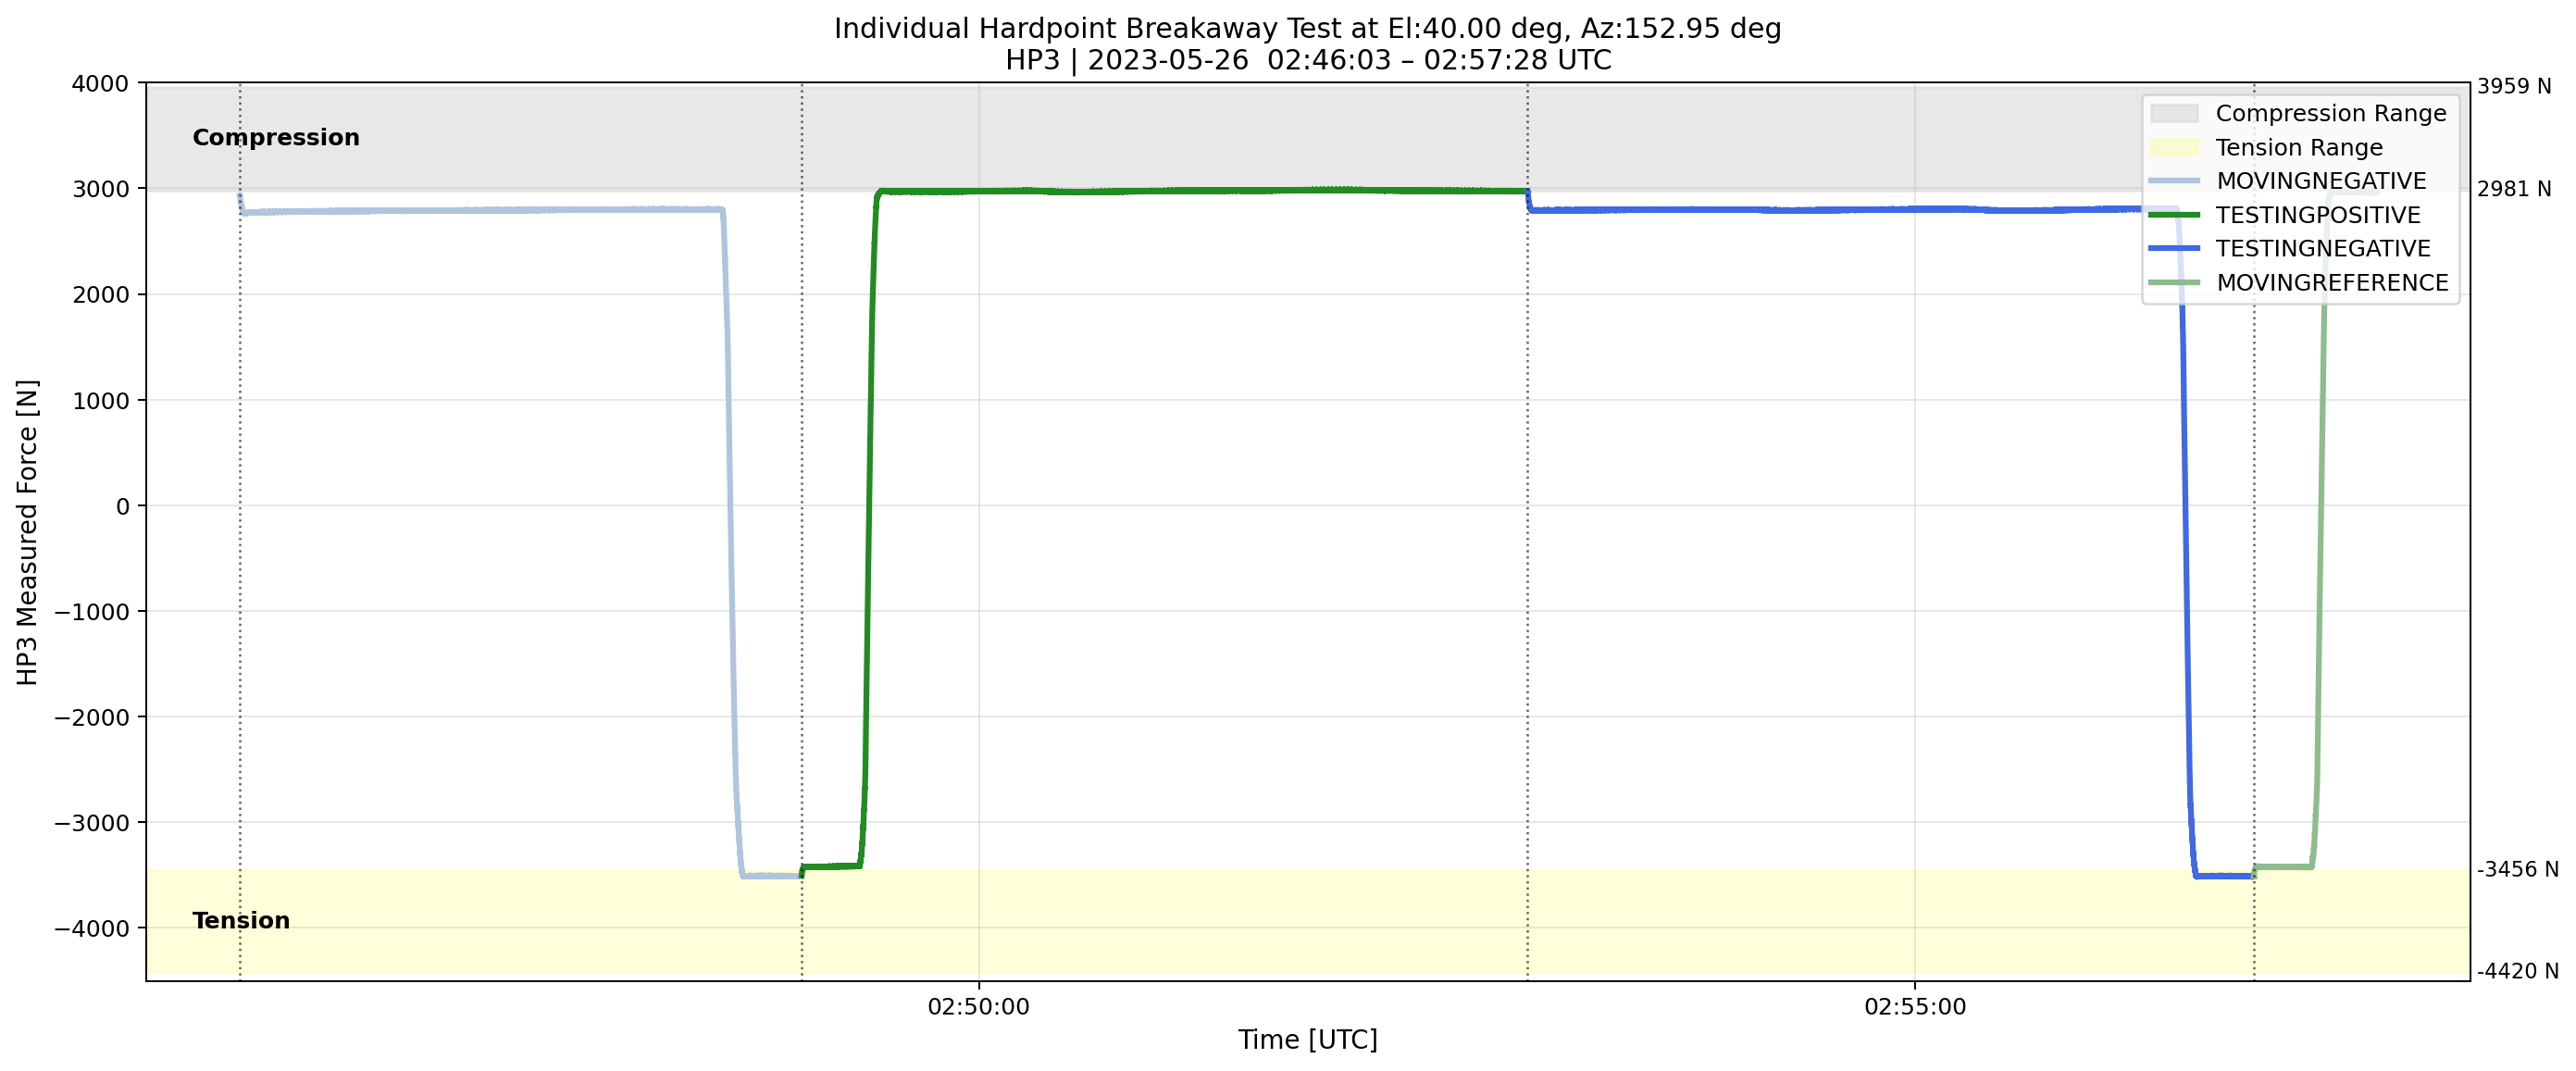
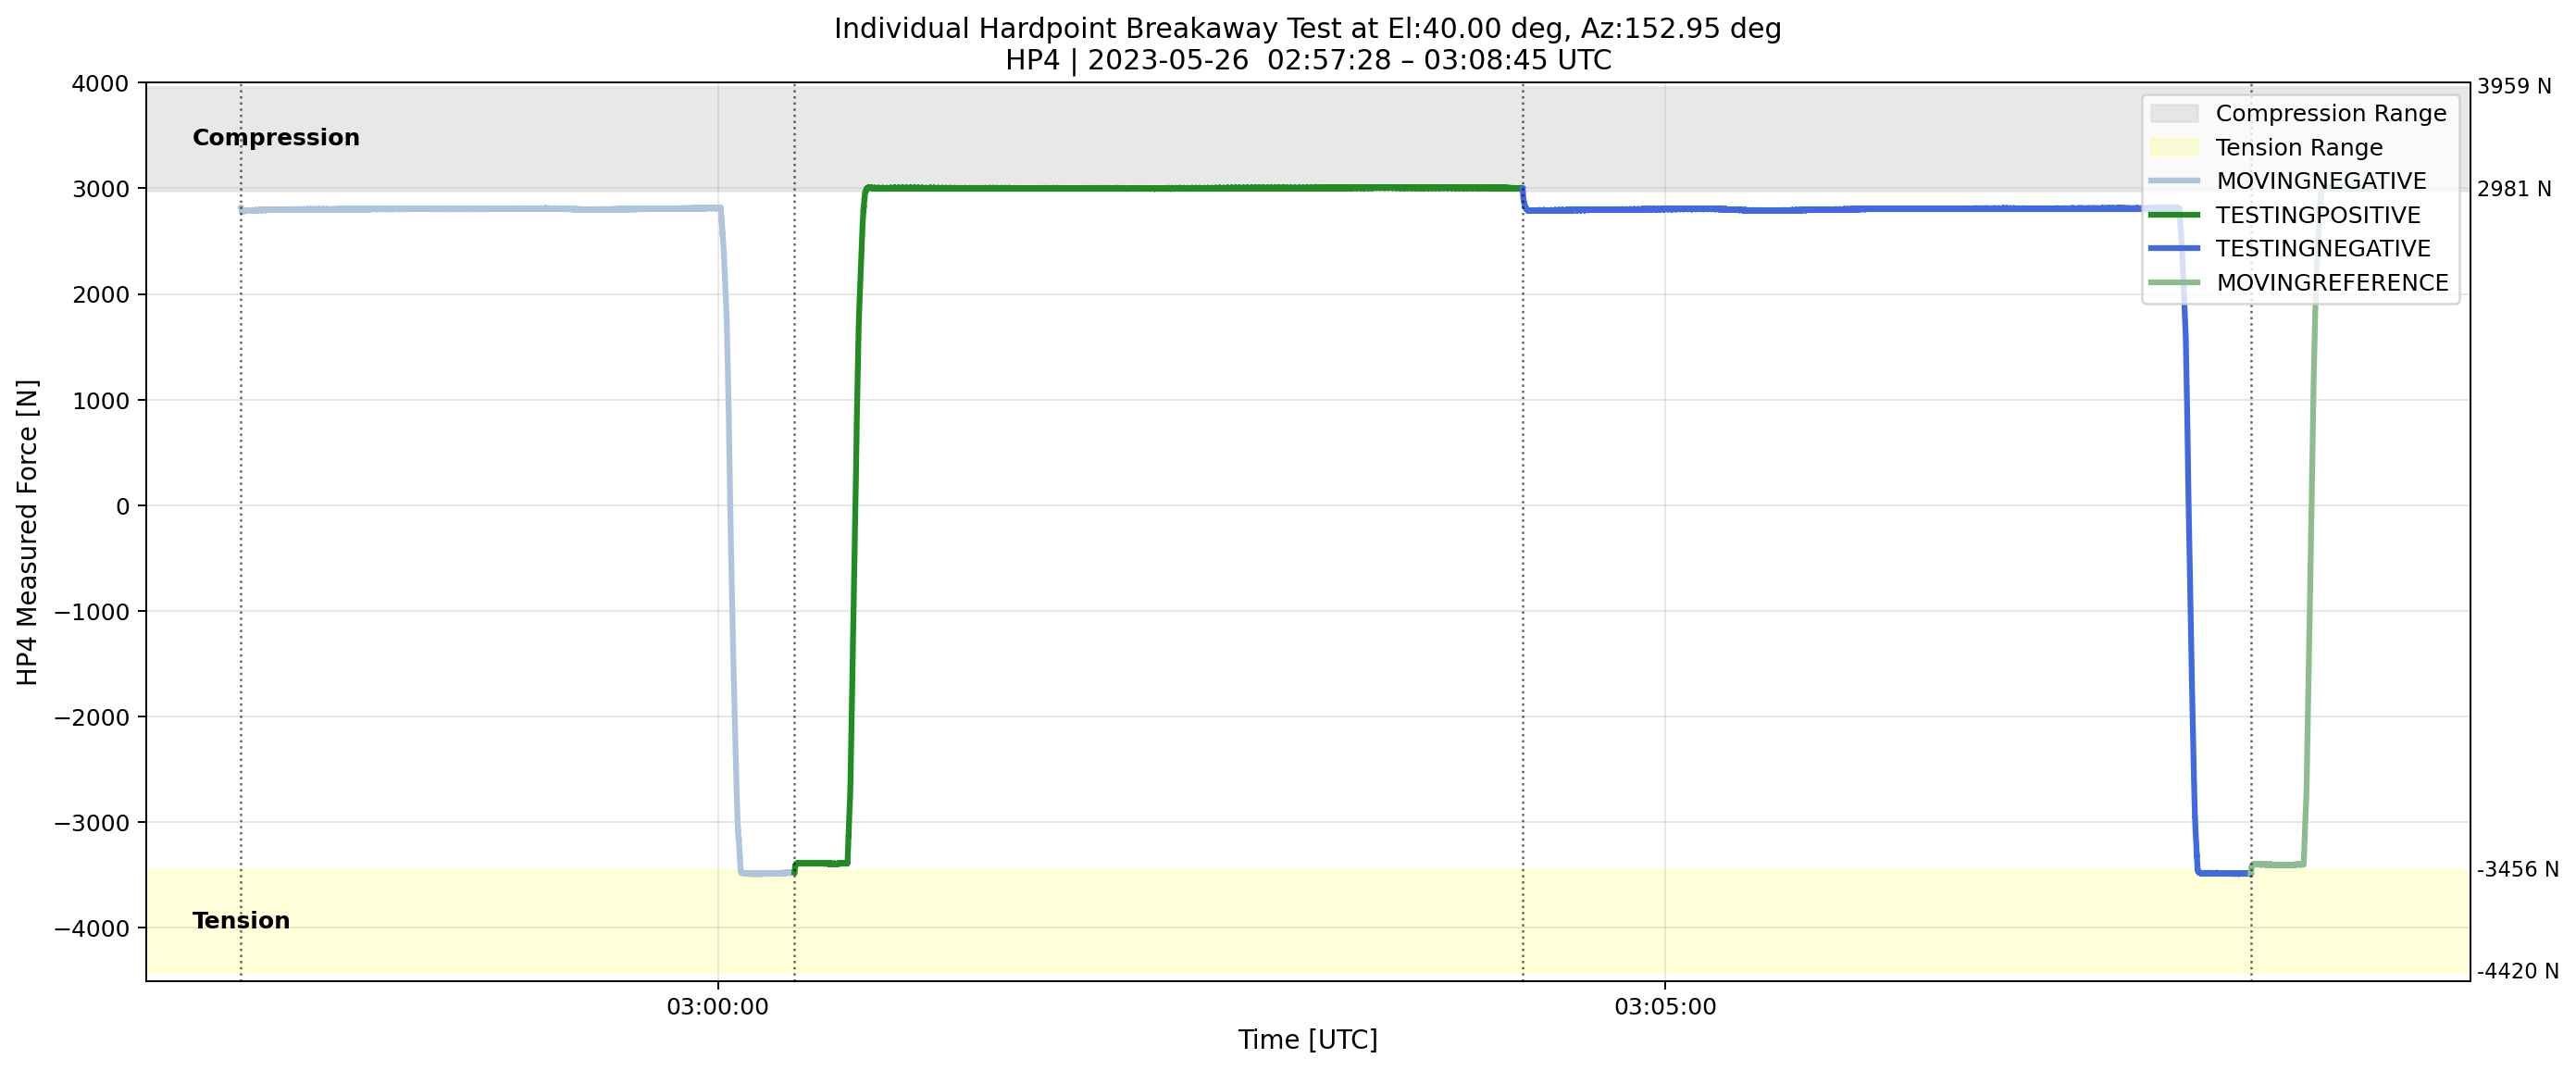
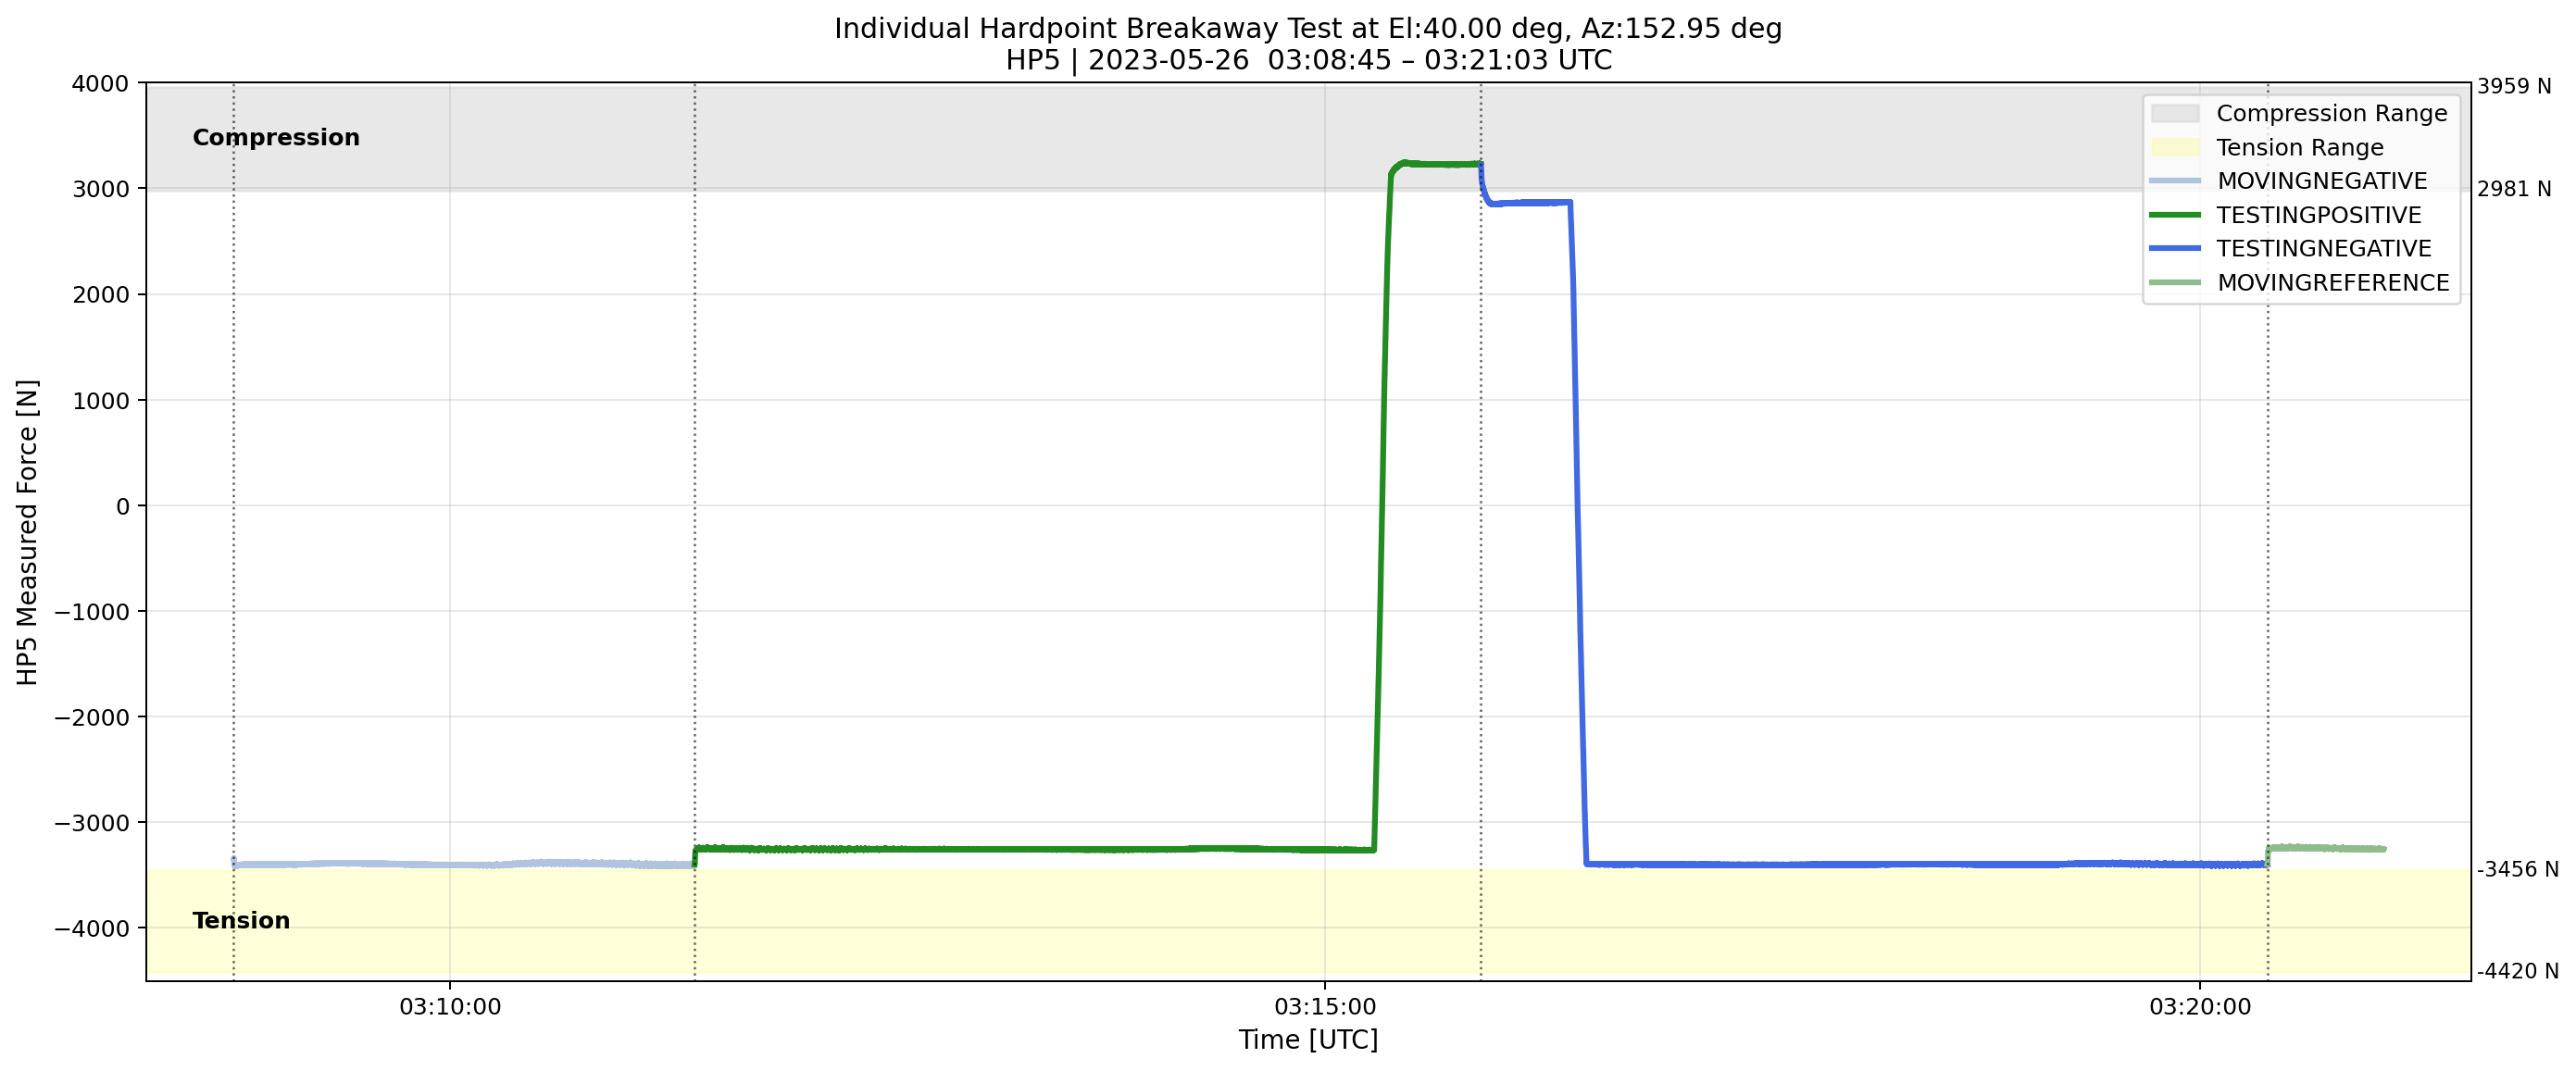
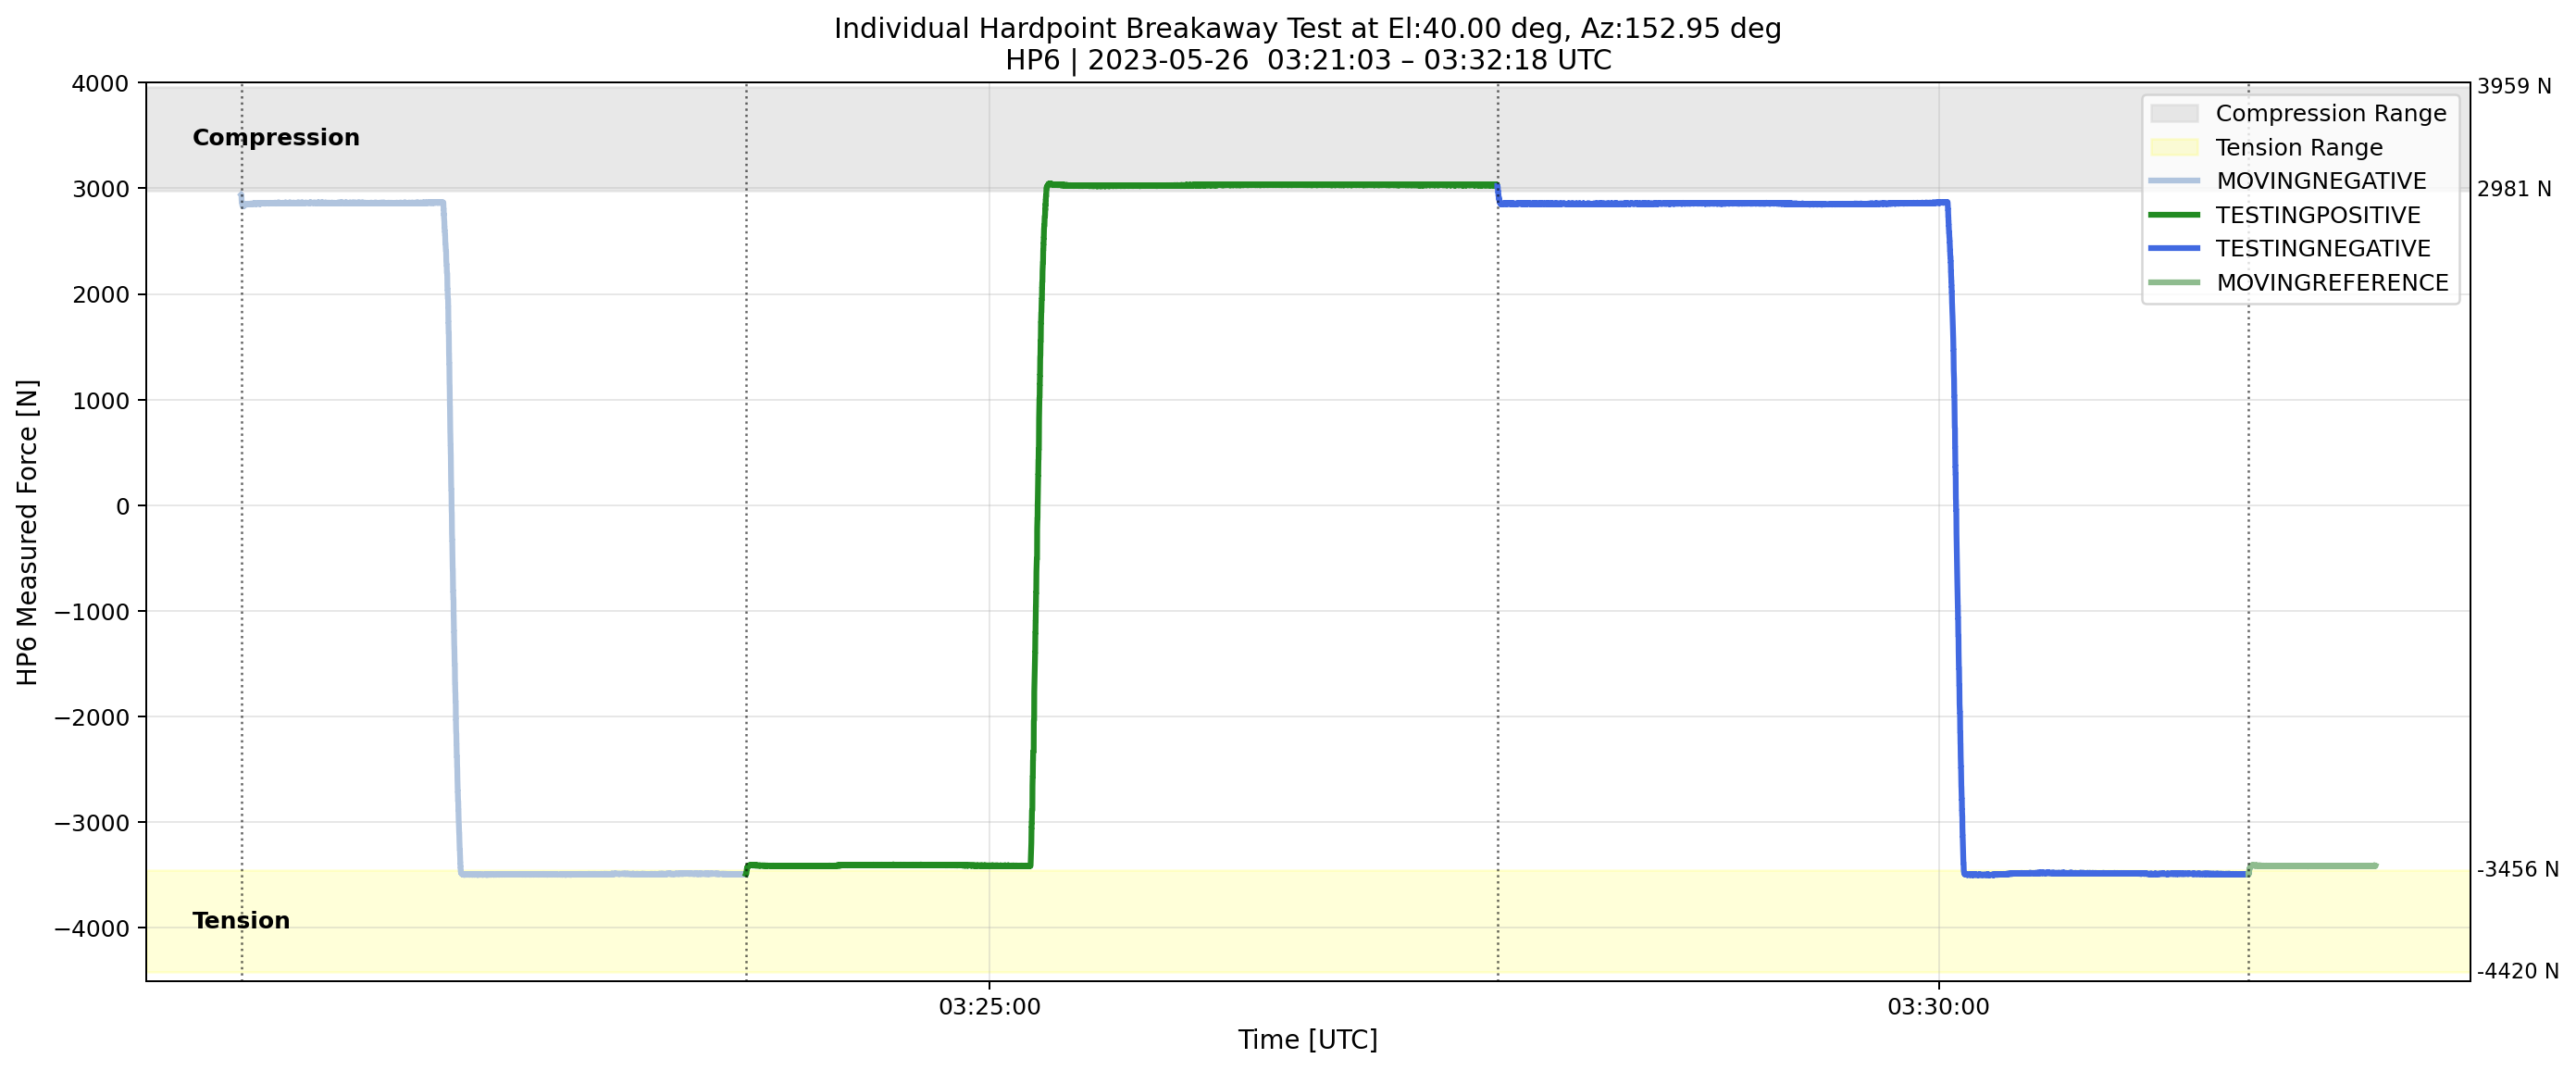
Fig. 7 Transition of the measured forces on each hardpoint when the TMA is at el=40deg.#
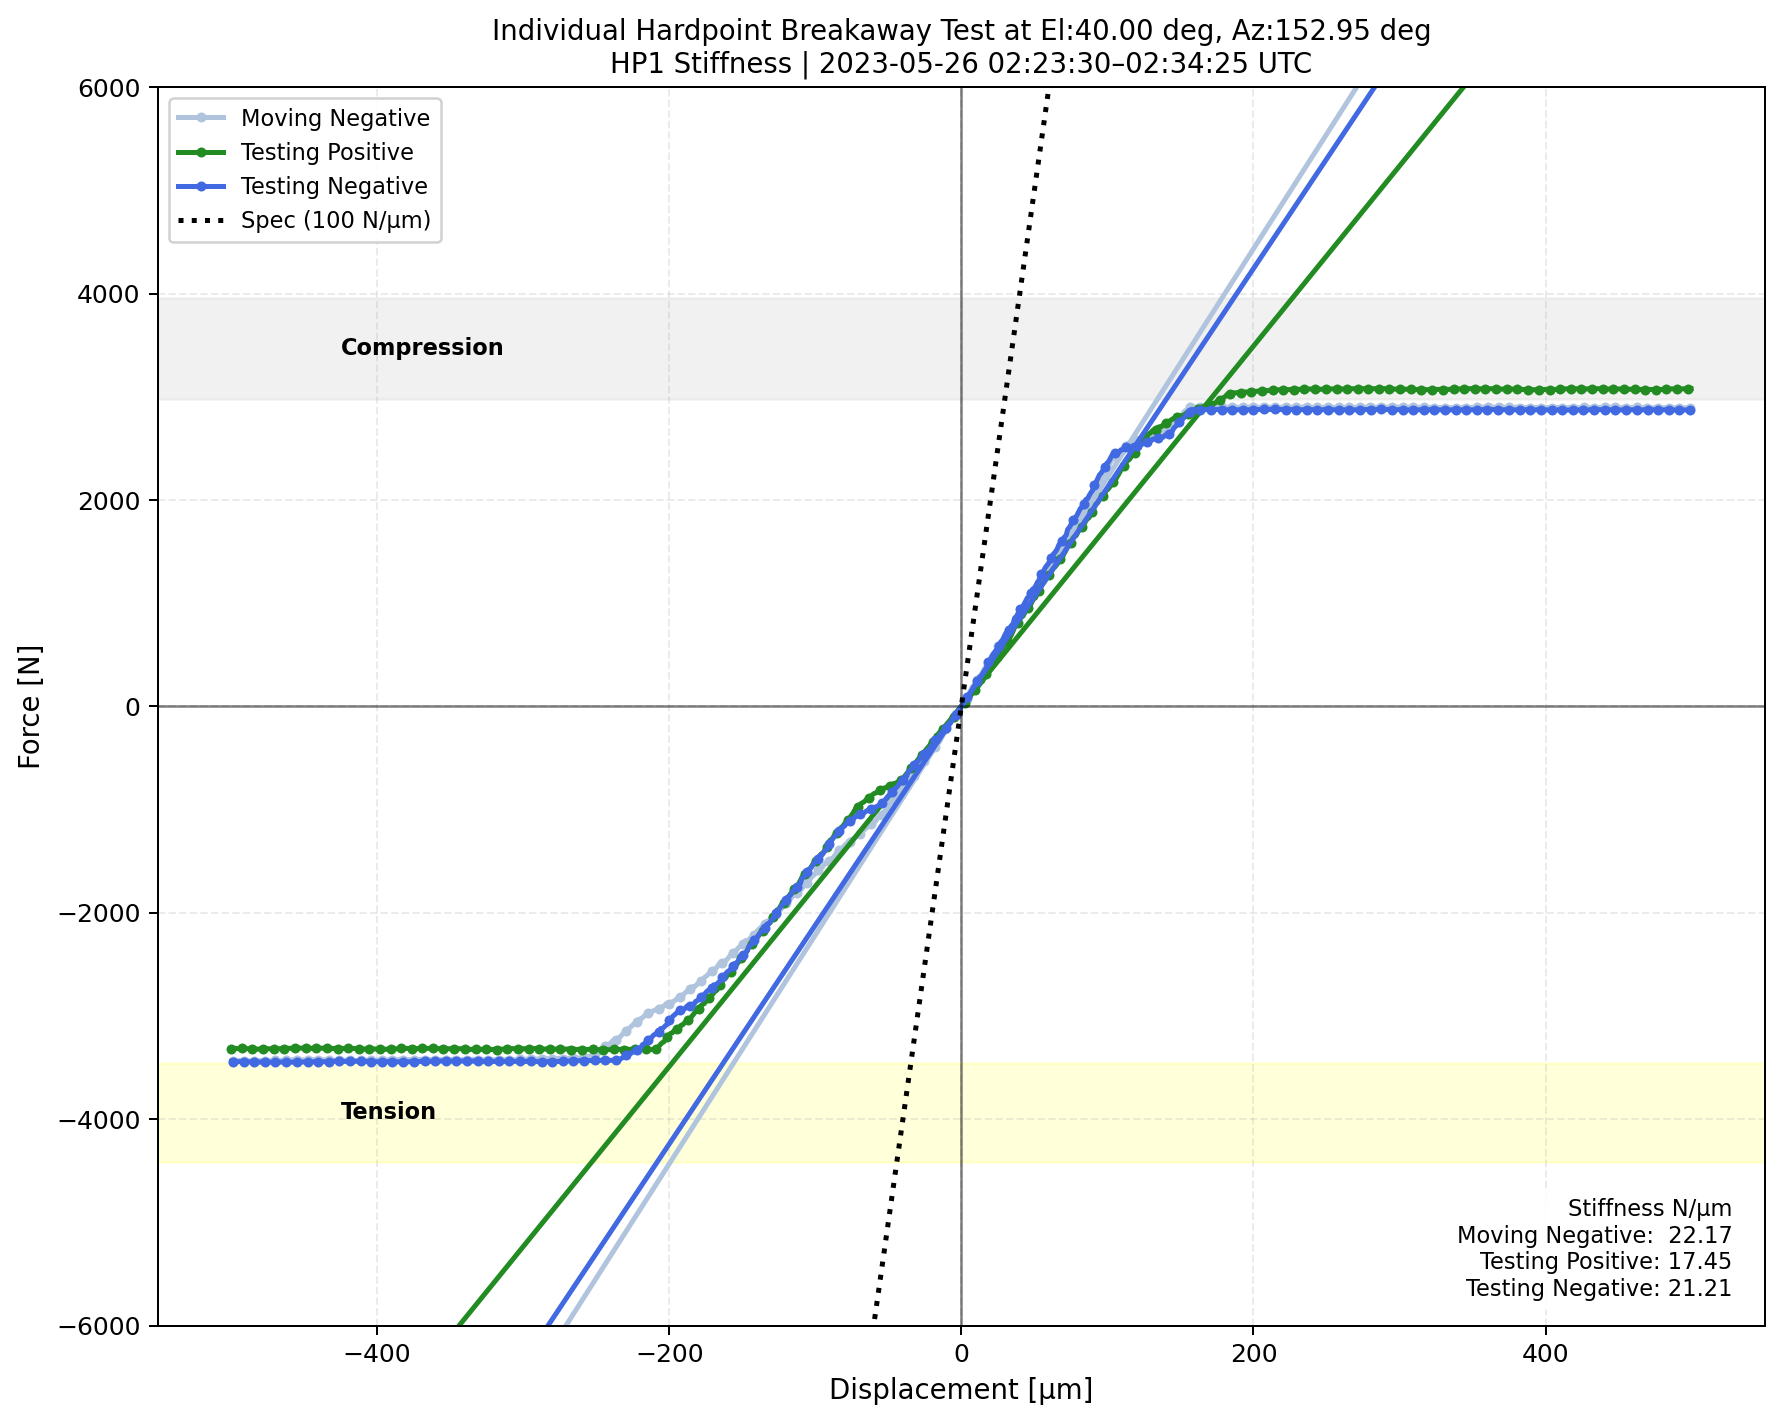
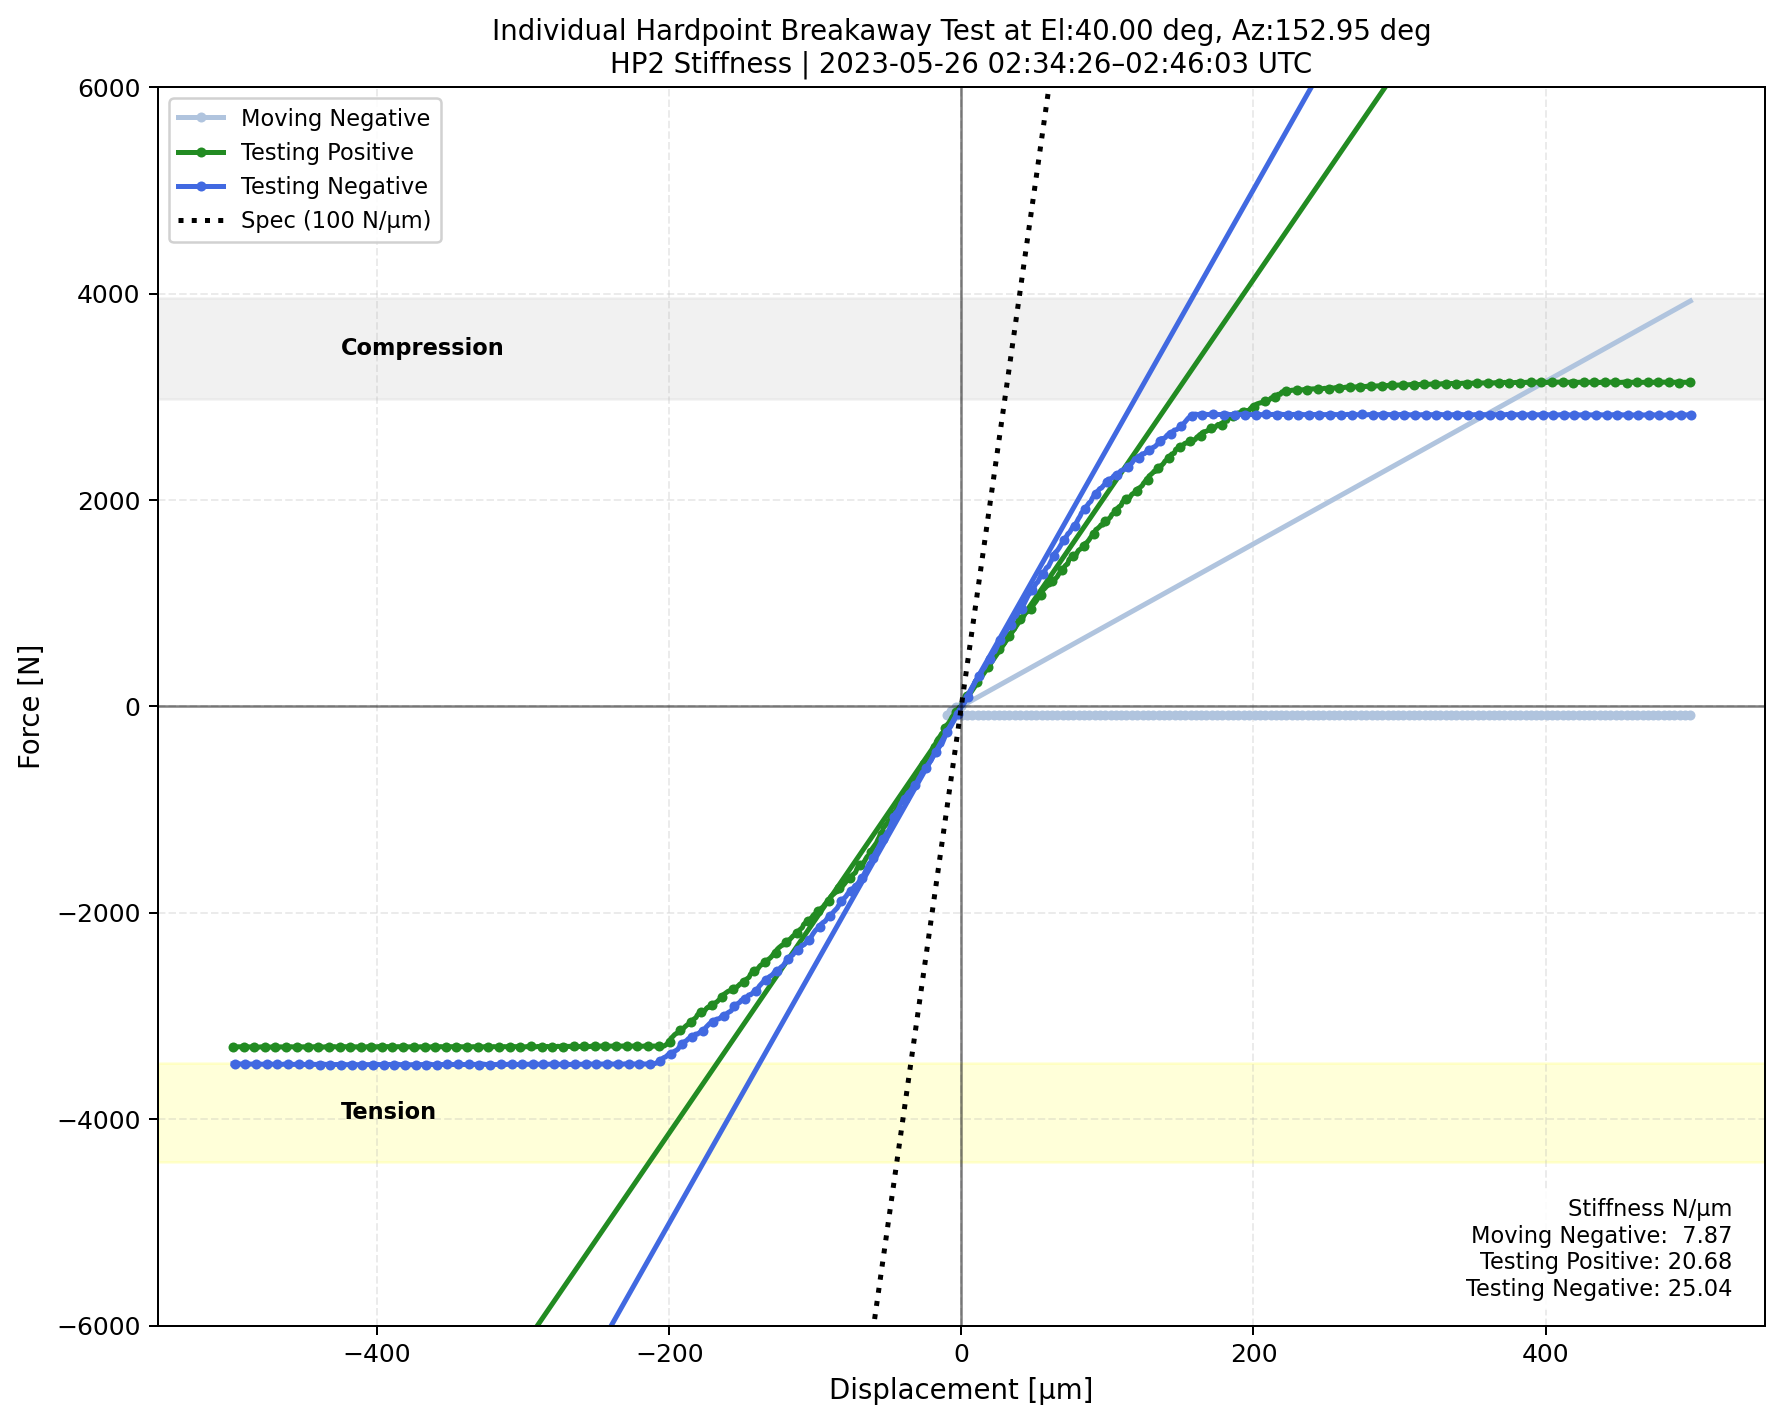


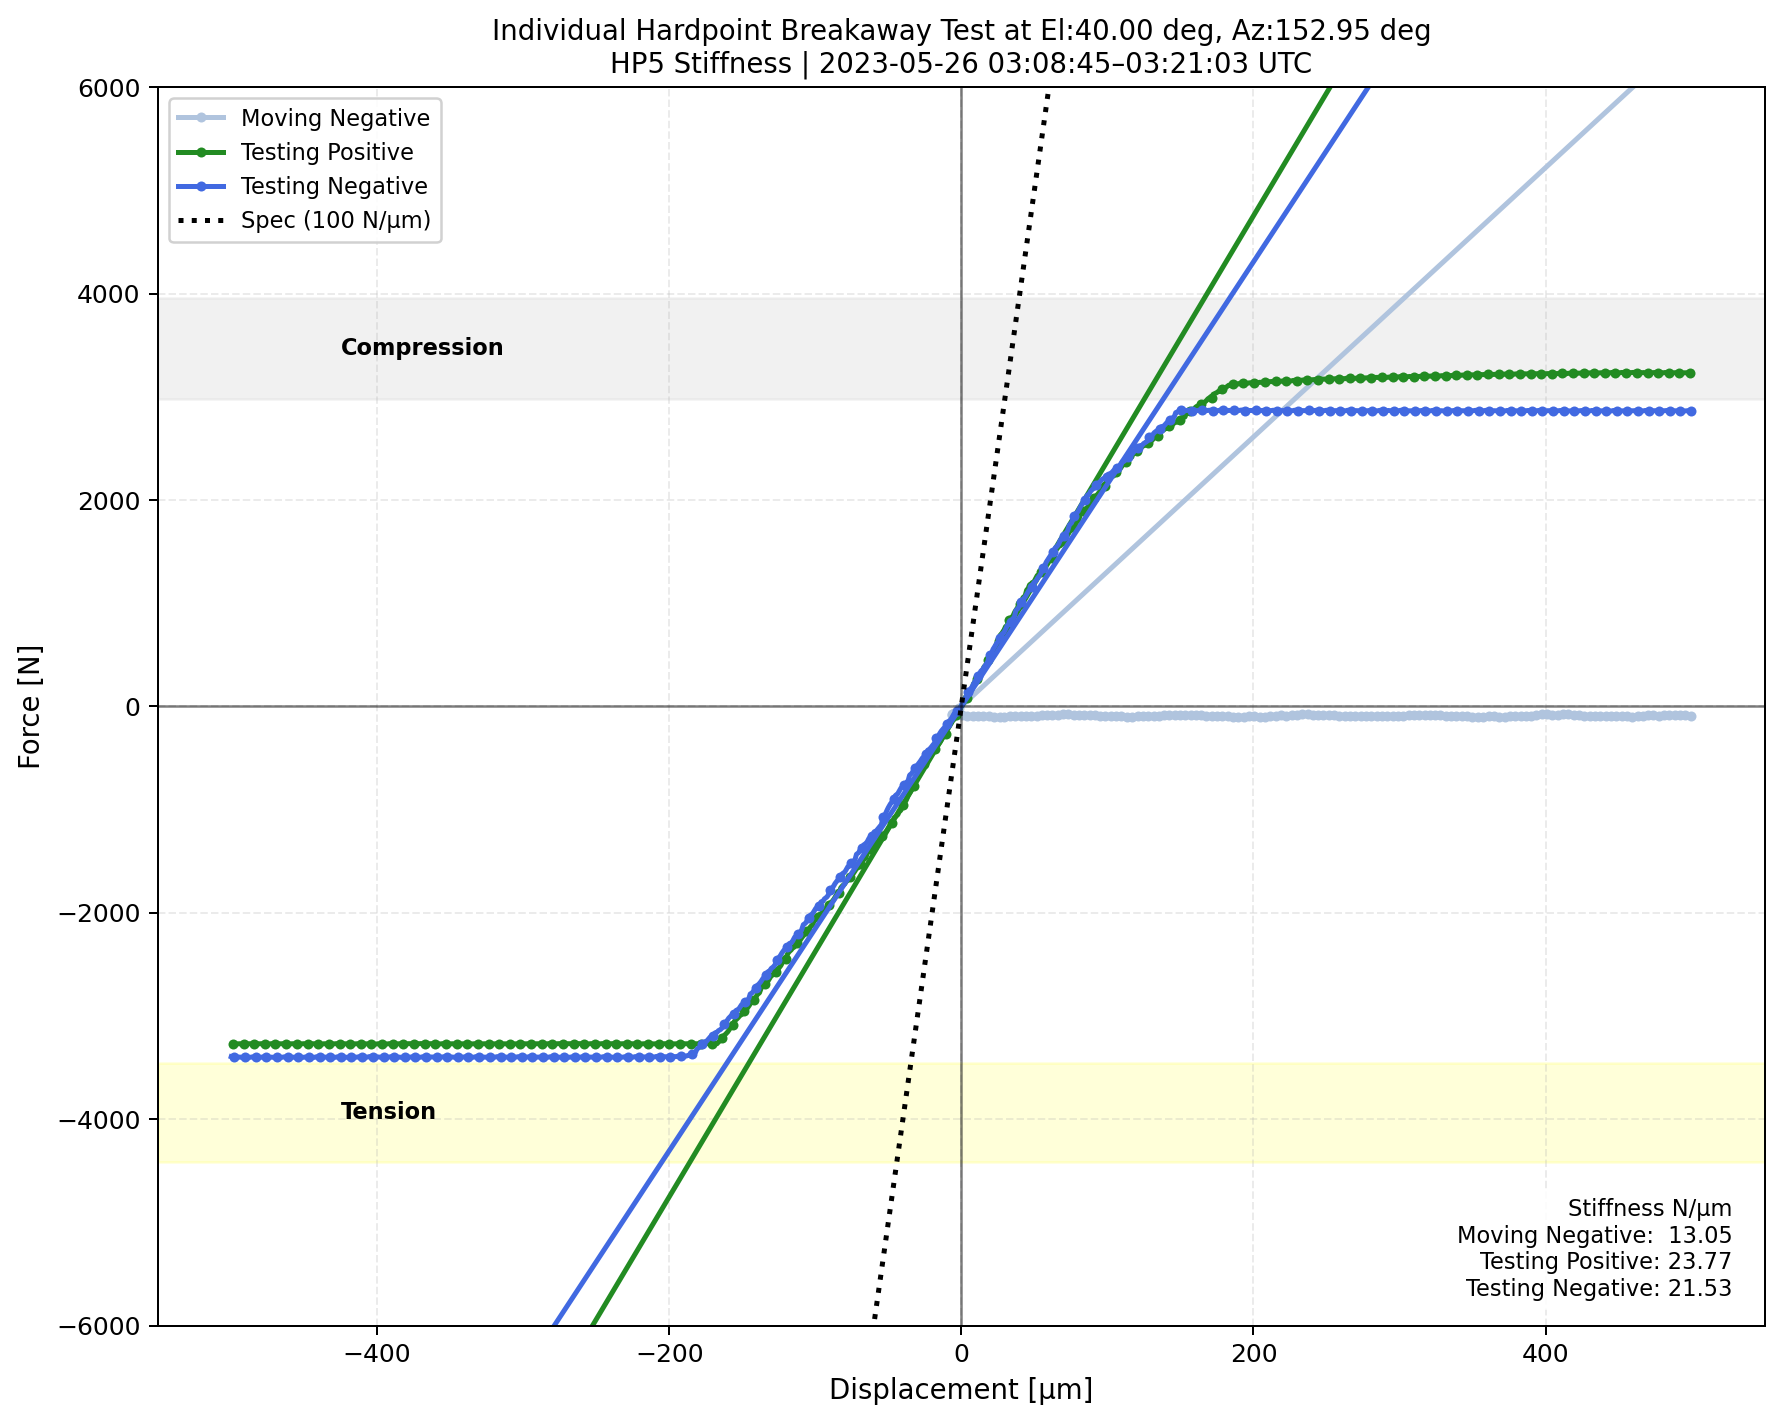
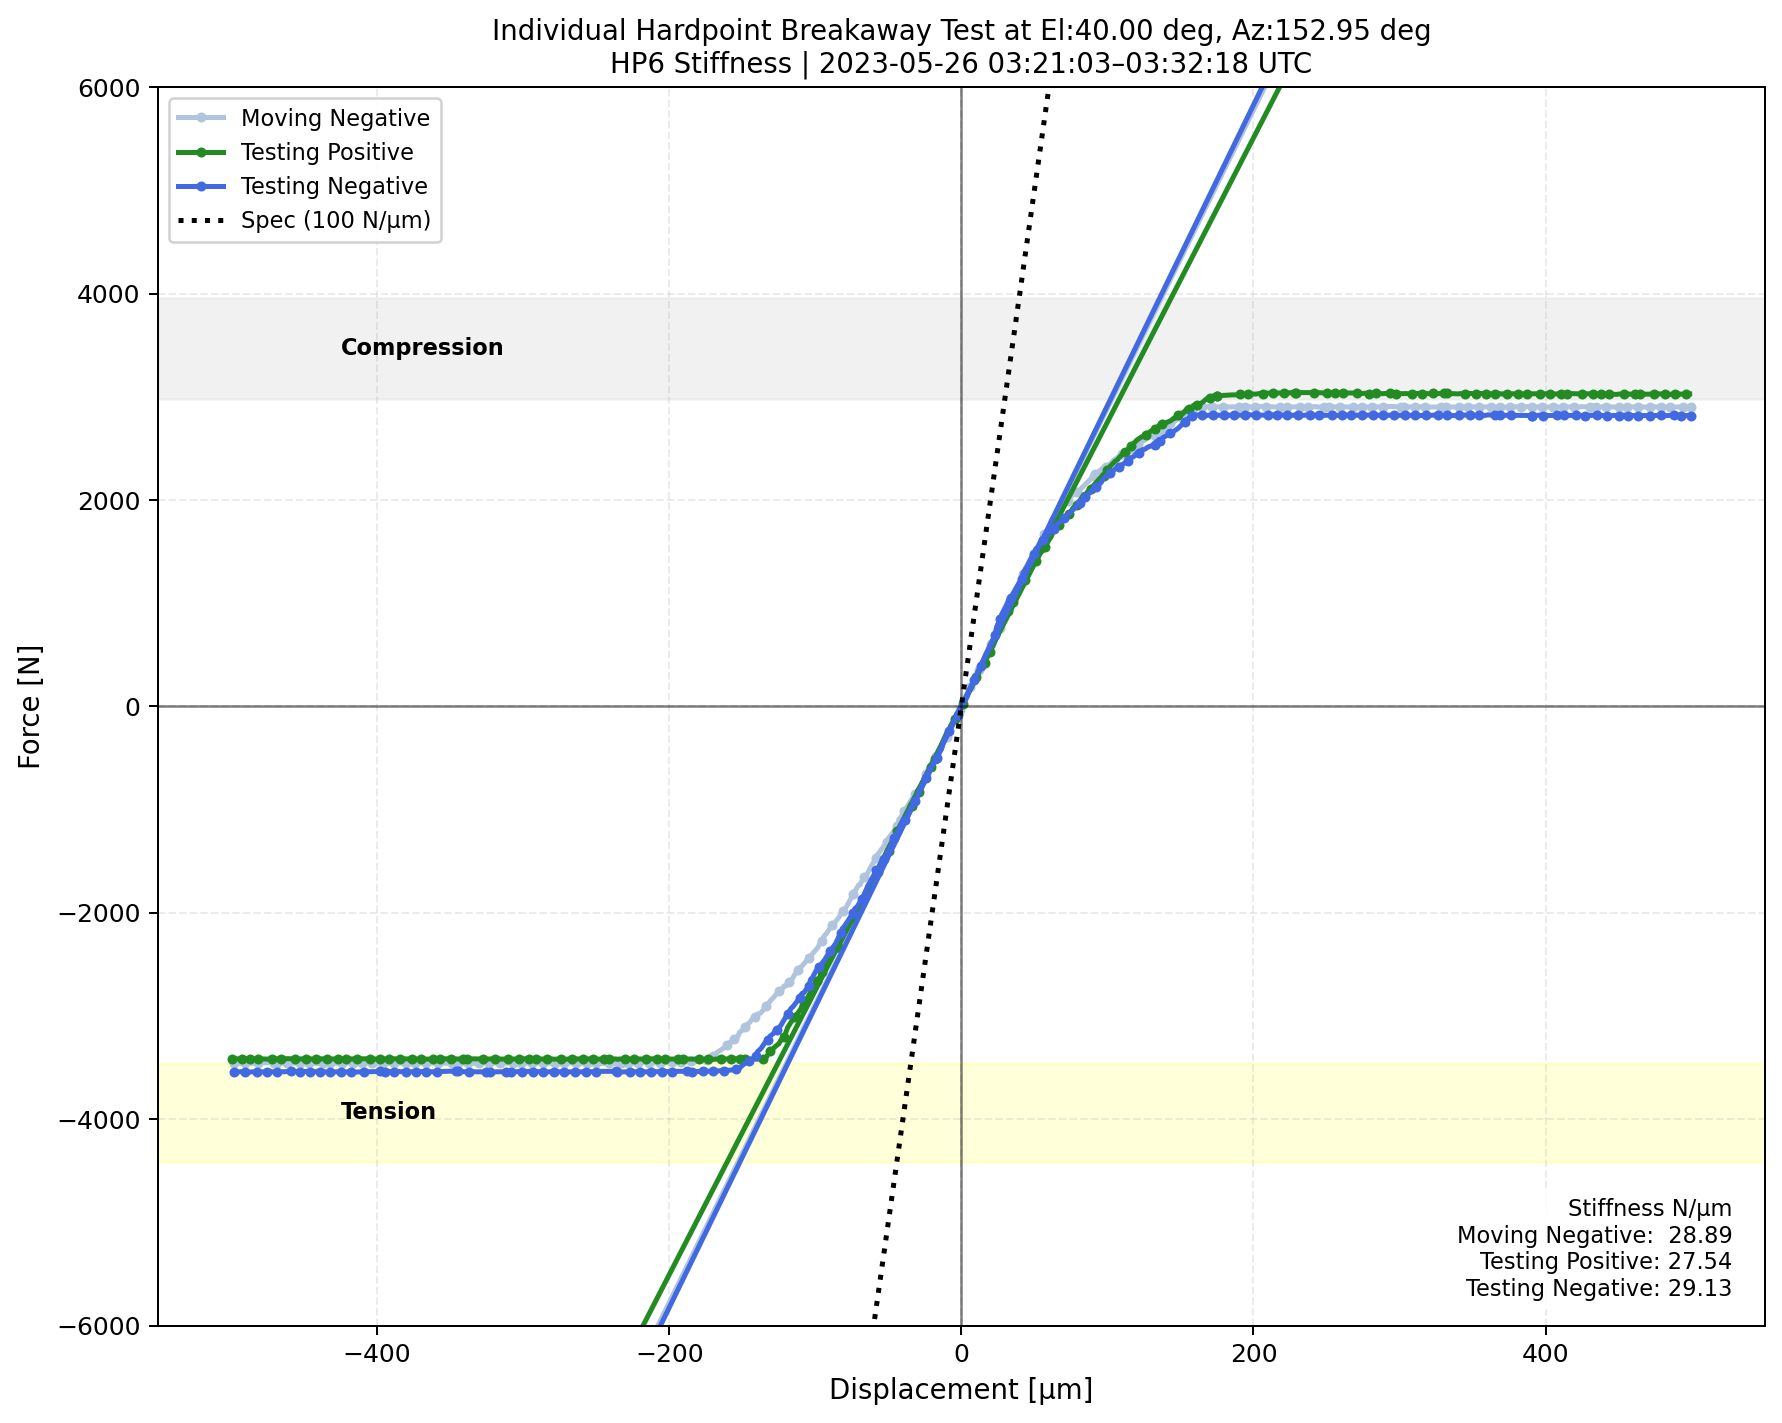
Fig. 8 <math>\Delta</math>Displacement versus measured forces for each phase during the hardpoint breakaway test when the TMA is at el=40deg.#
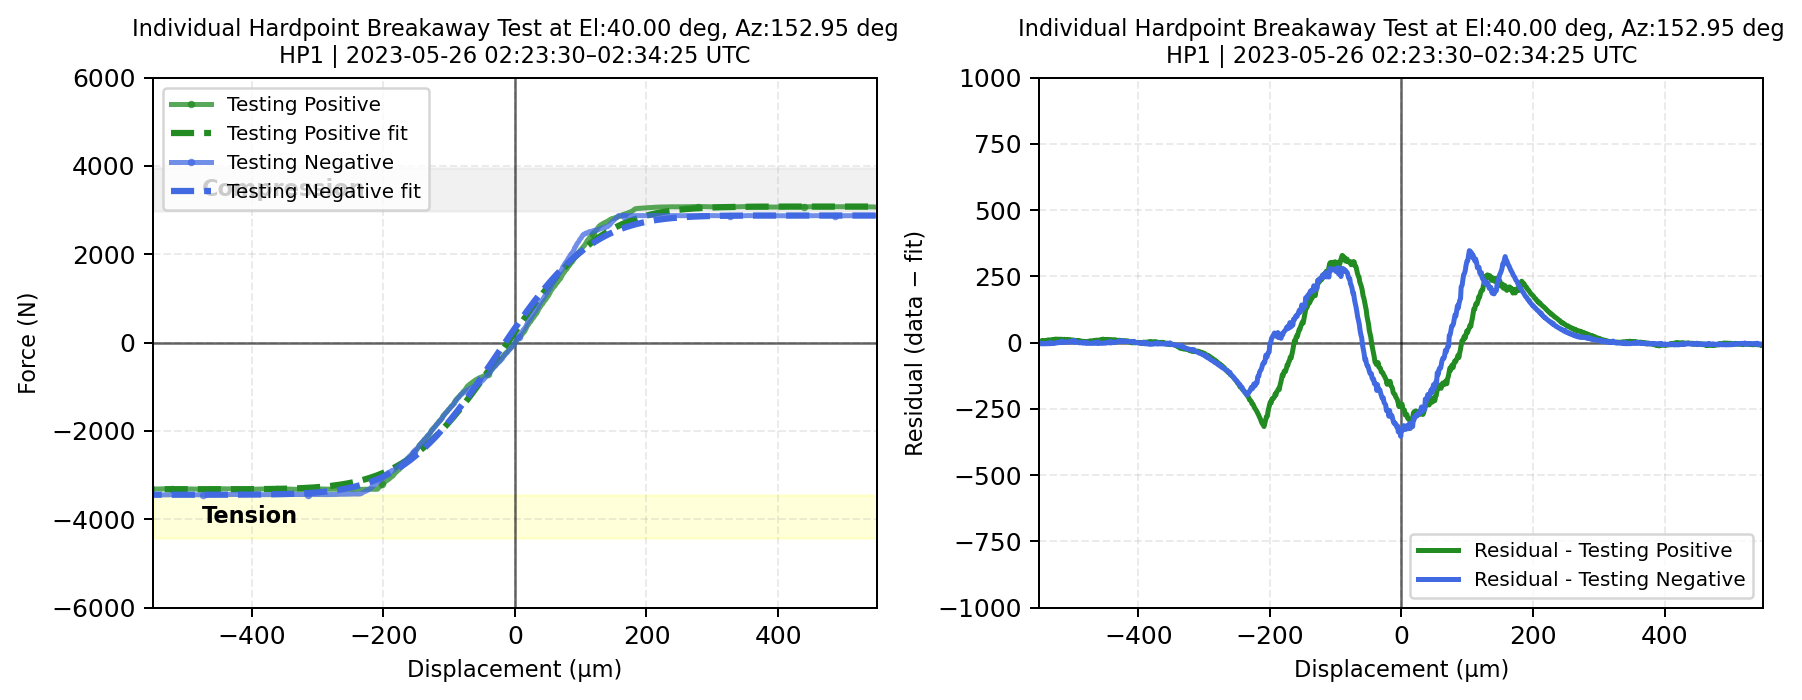
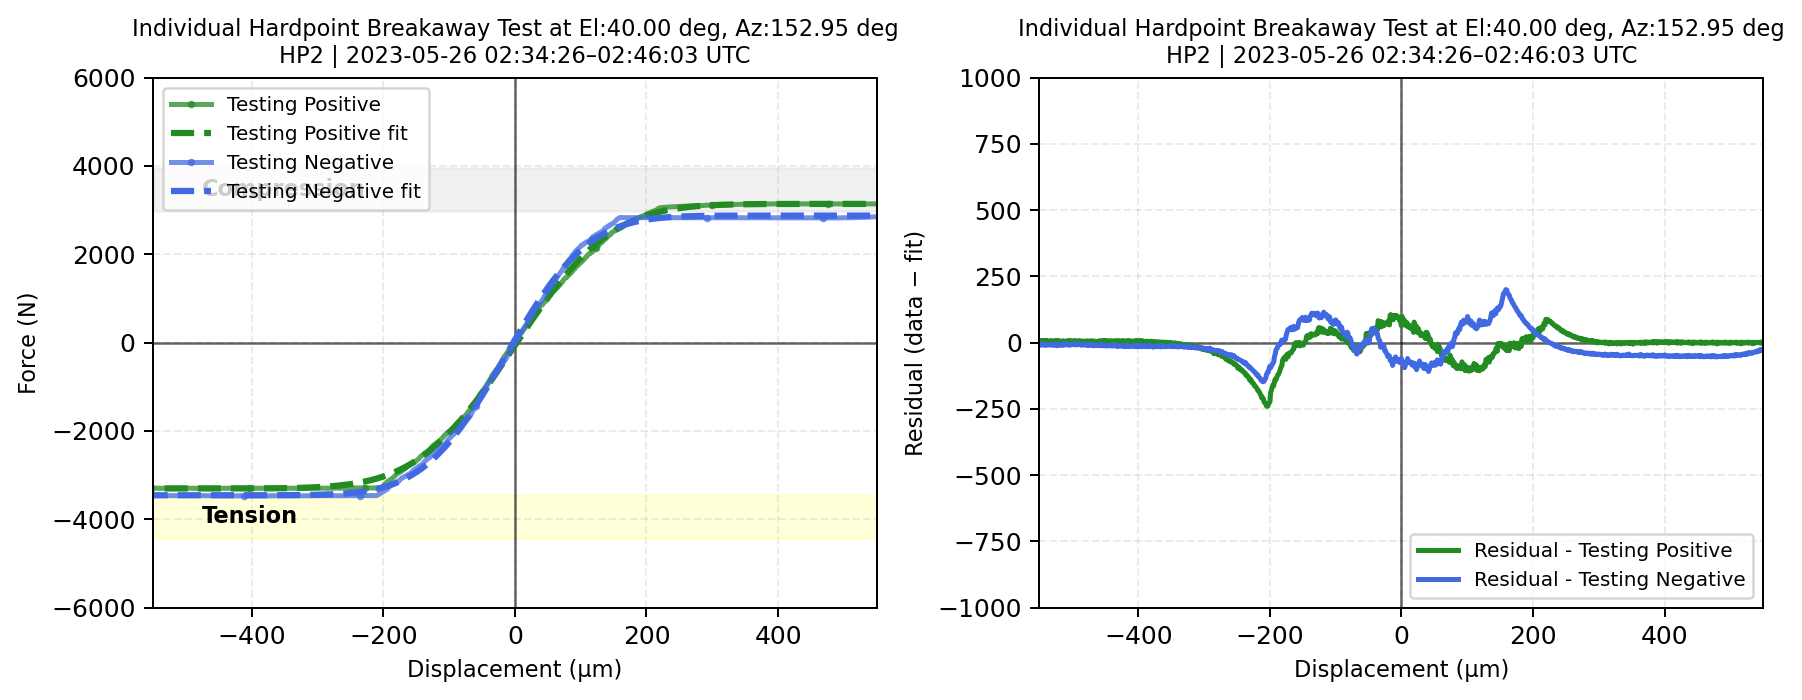
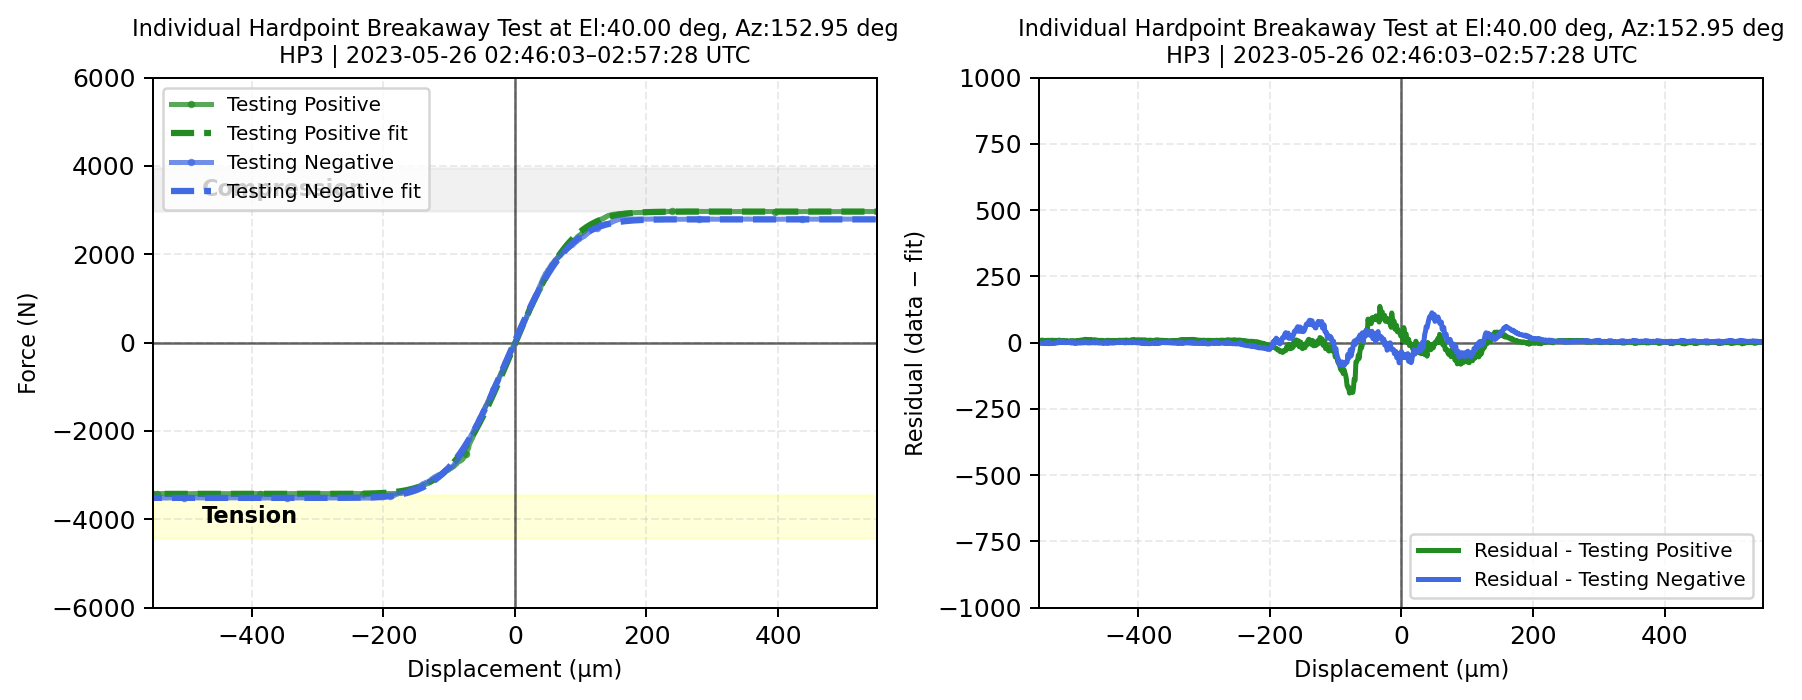
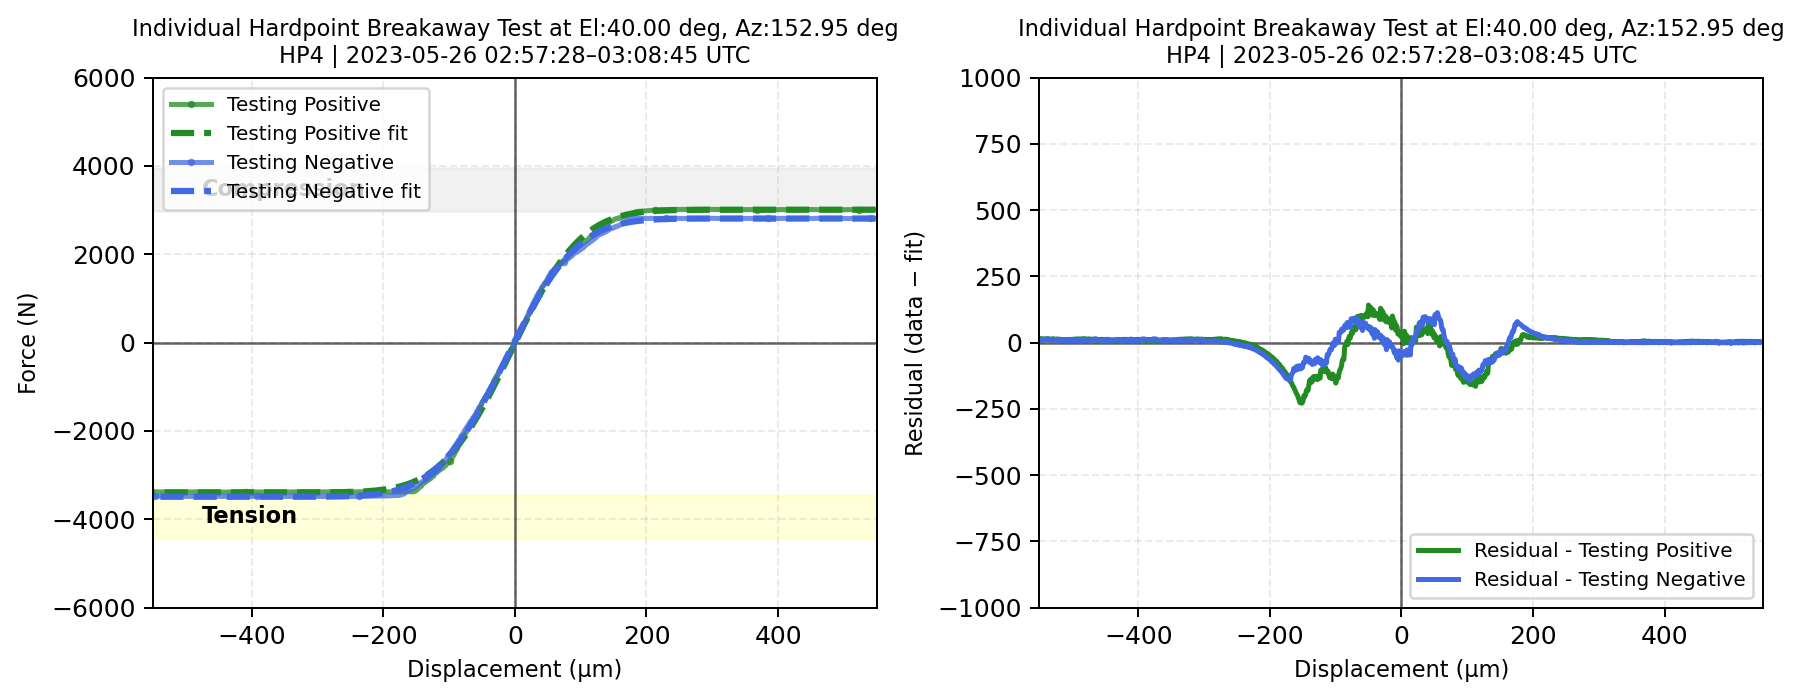


Fig. 9 (Left) \(\Delta\)Displacement versus measured forces for each phase during the hardpoint breakaway test fit with error function (the TMA at el=40deg). (Right) The residual, a difference between data and error function, with respect to \(\Delta\)displacement#
HP Test at el 20 deg#
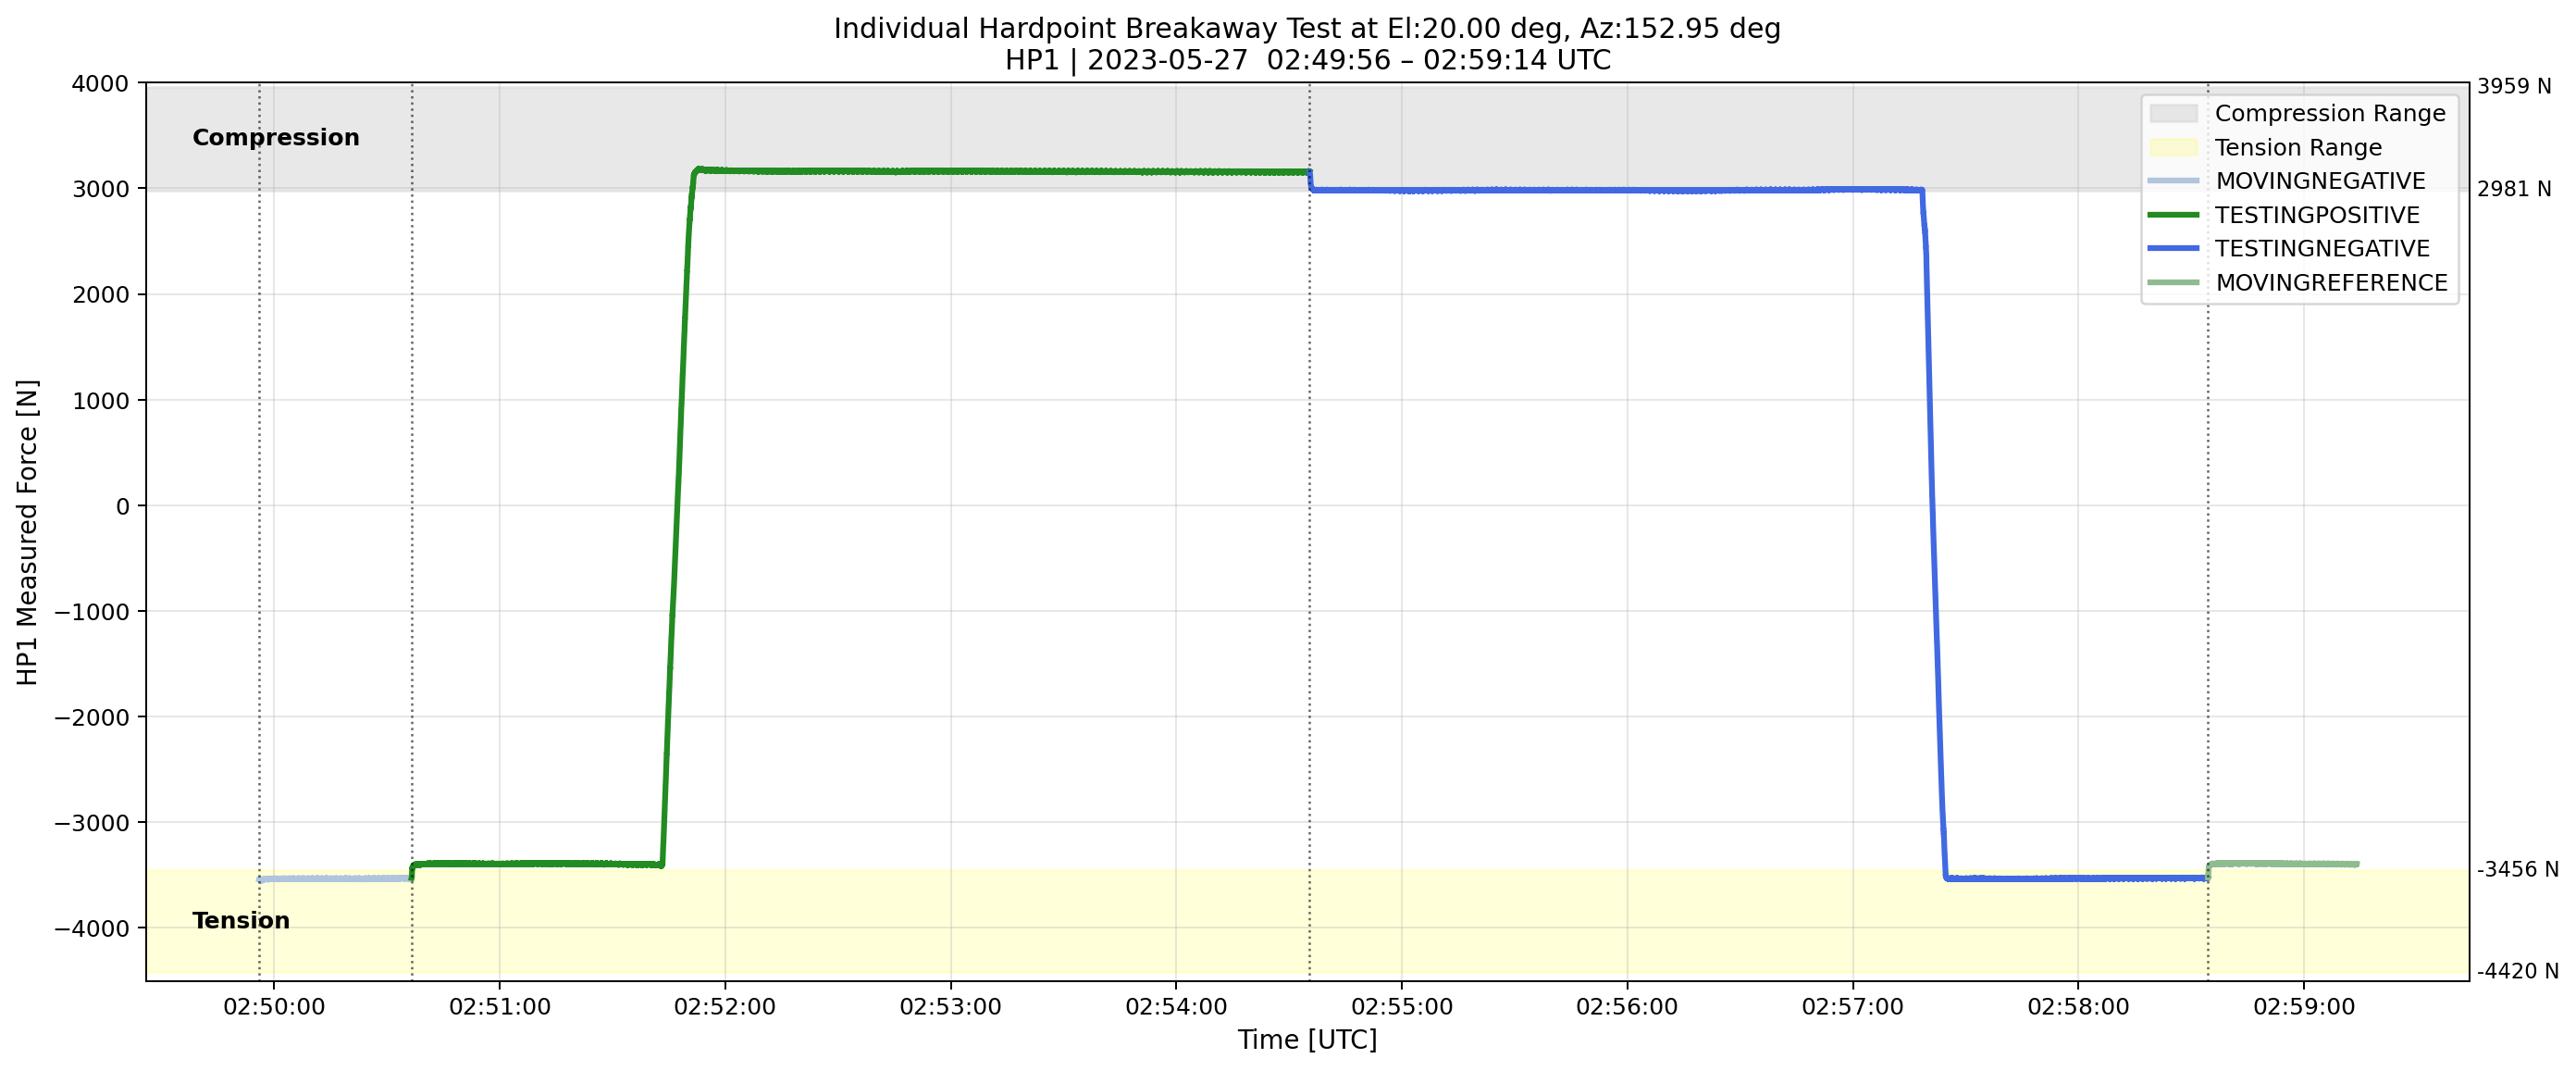
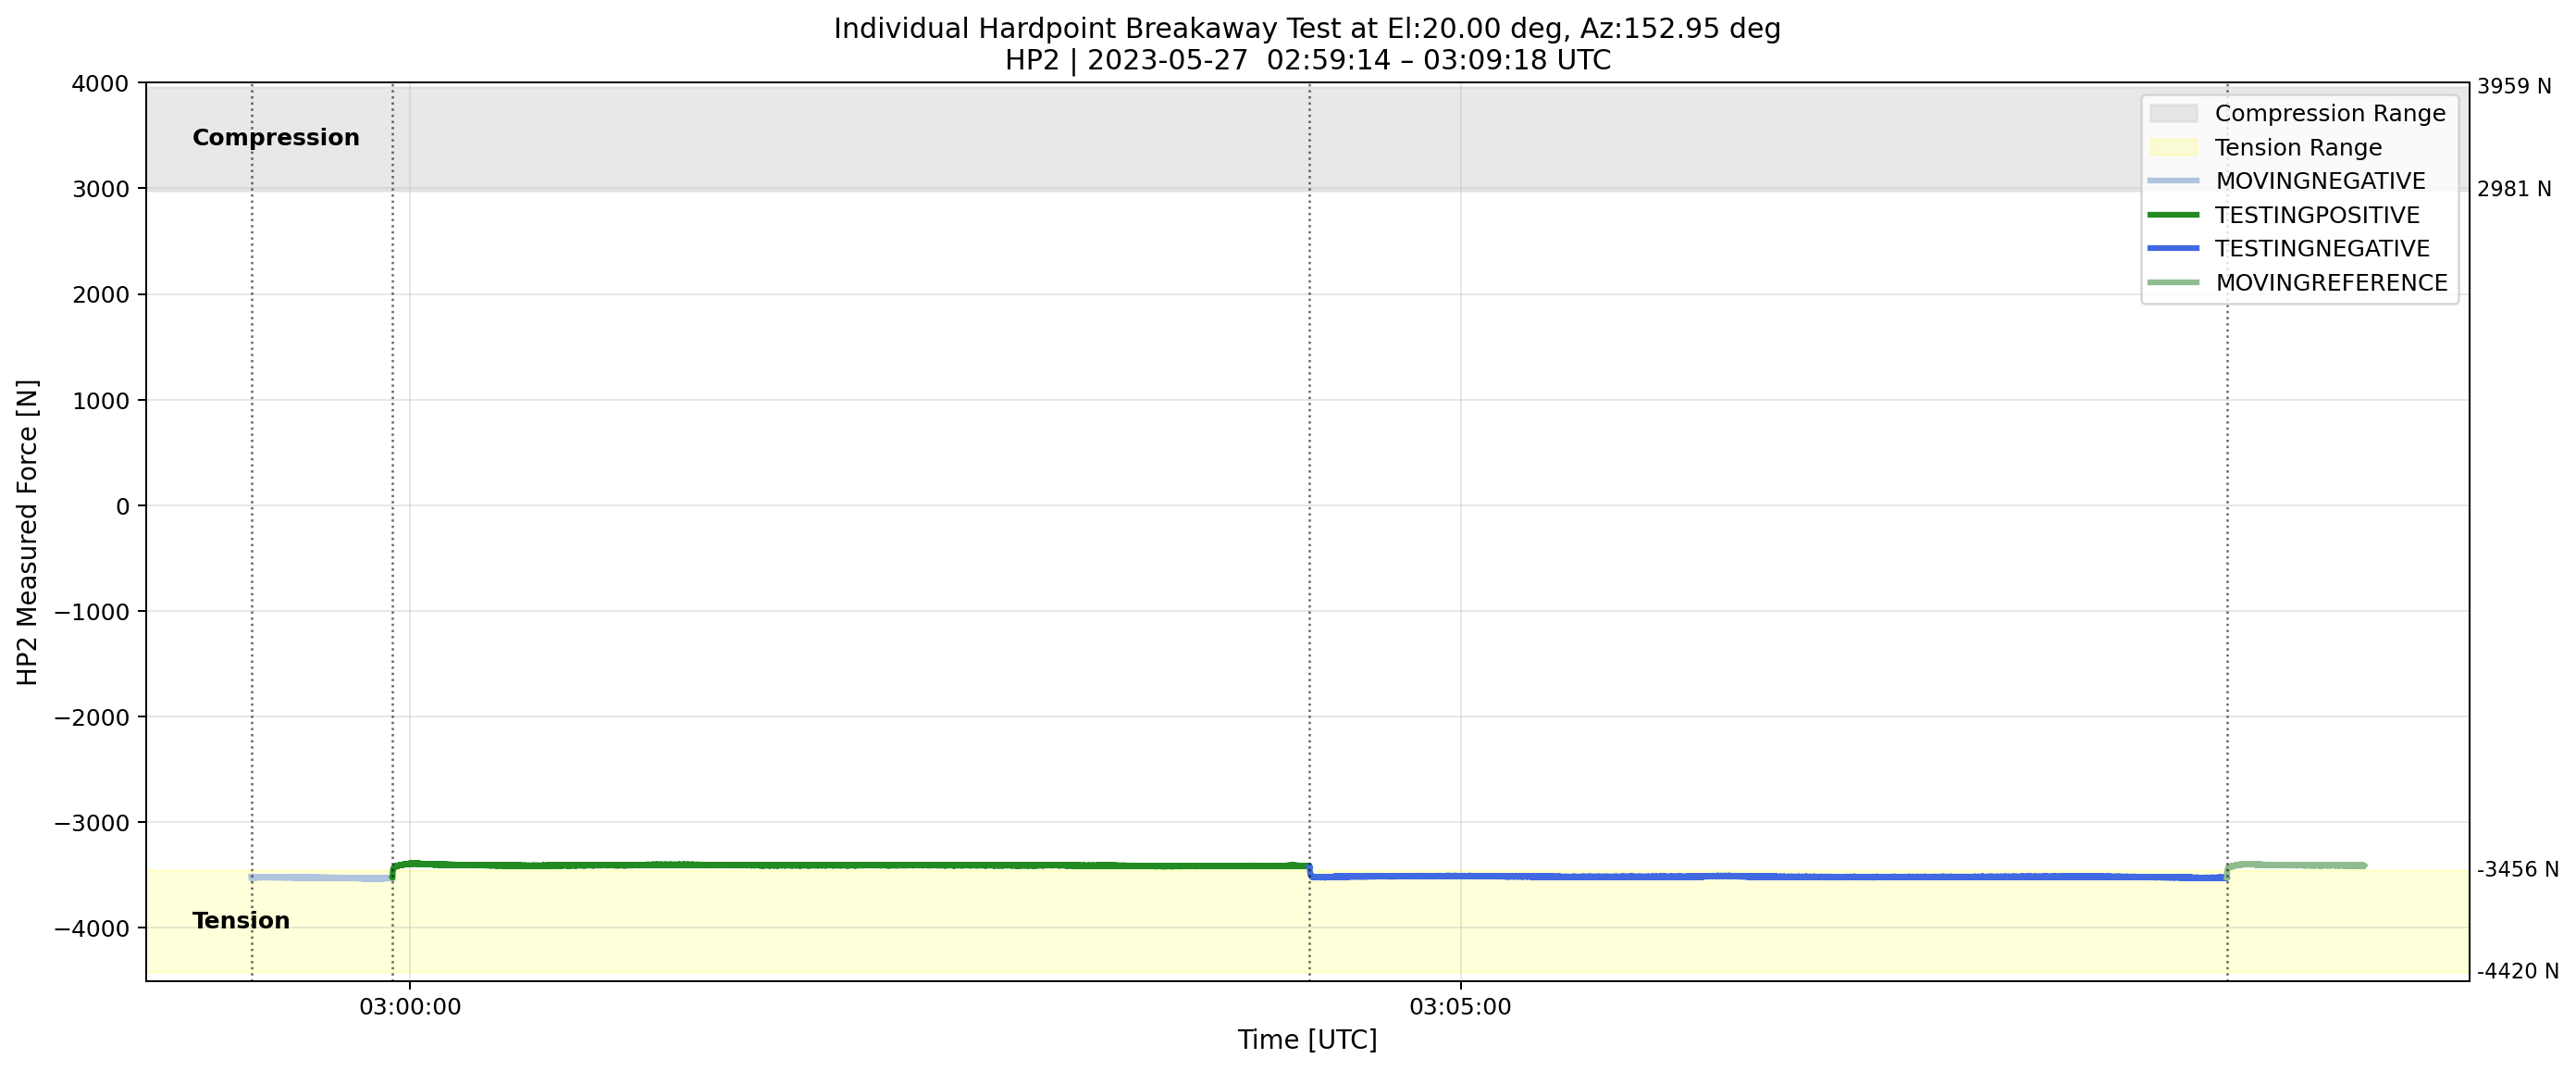
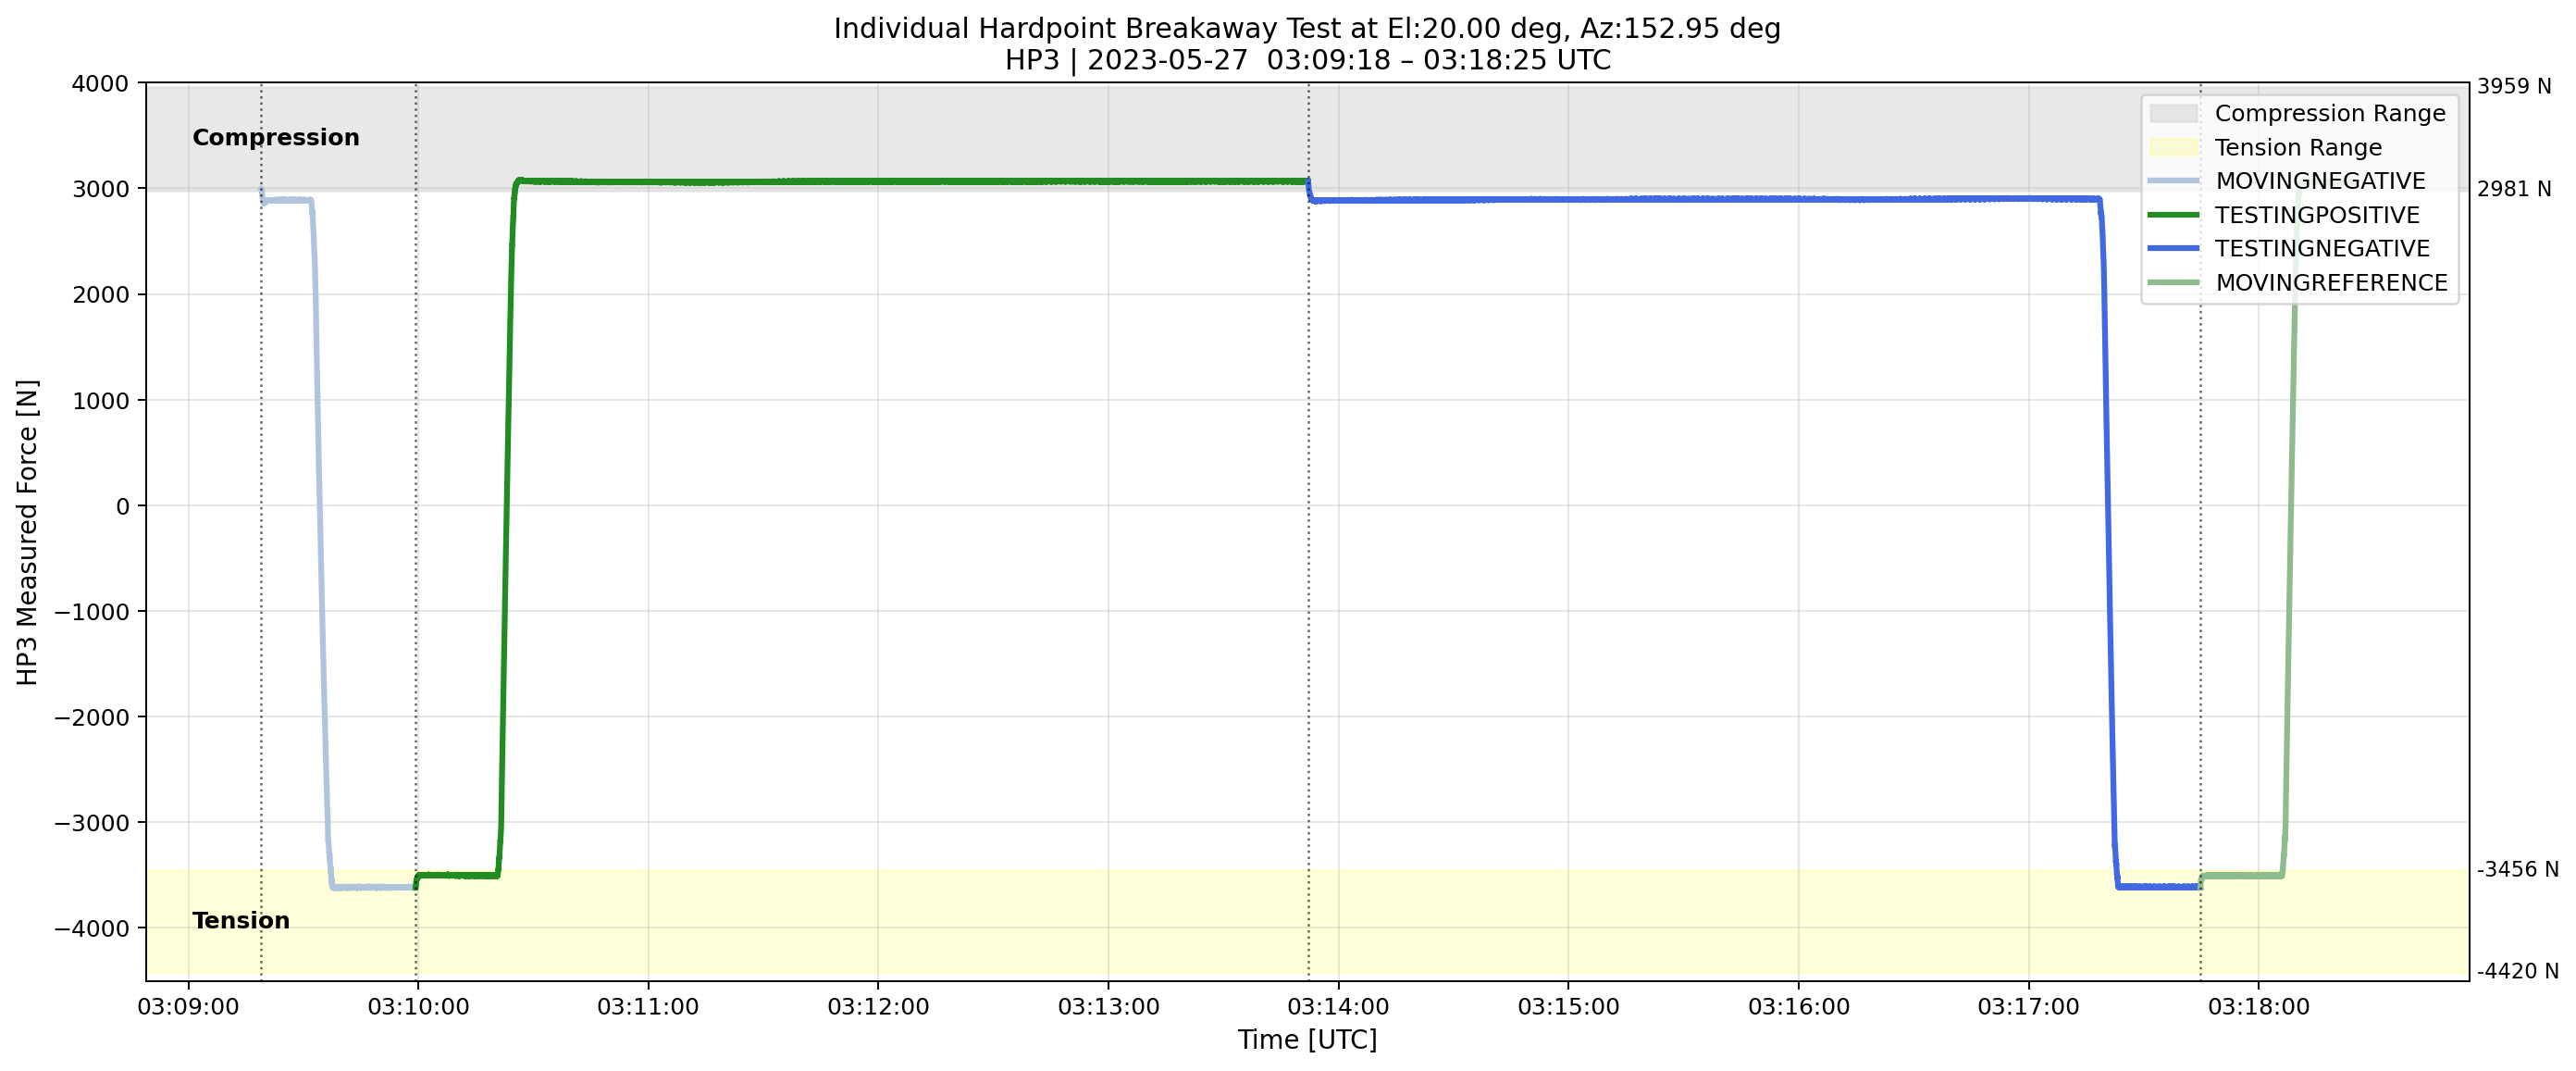
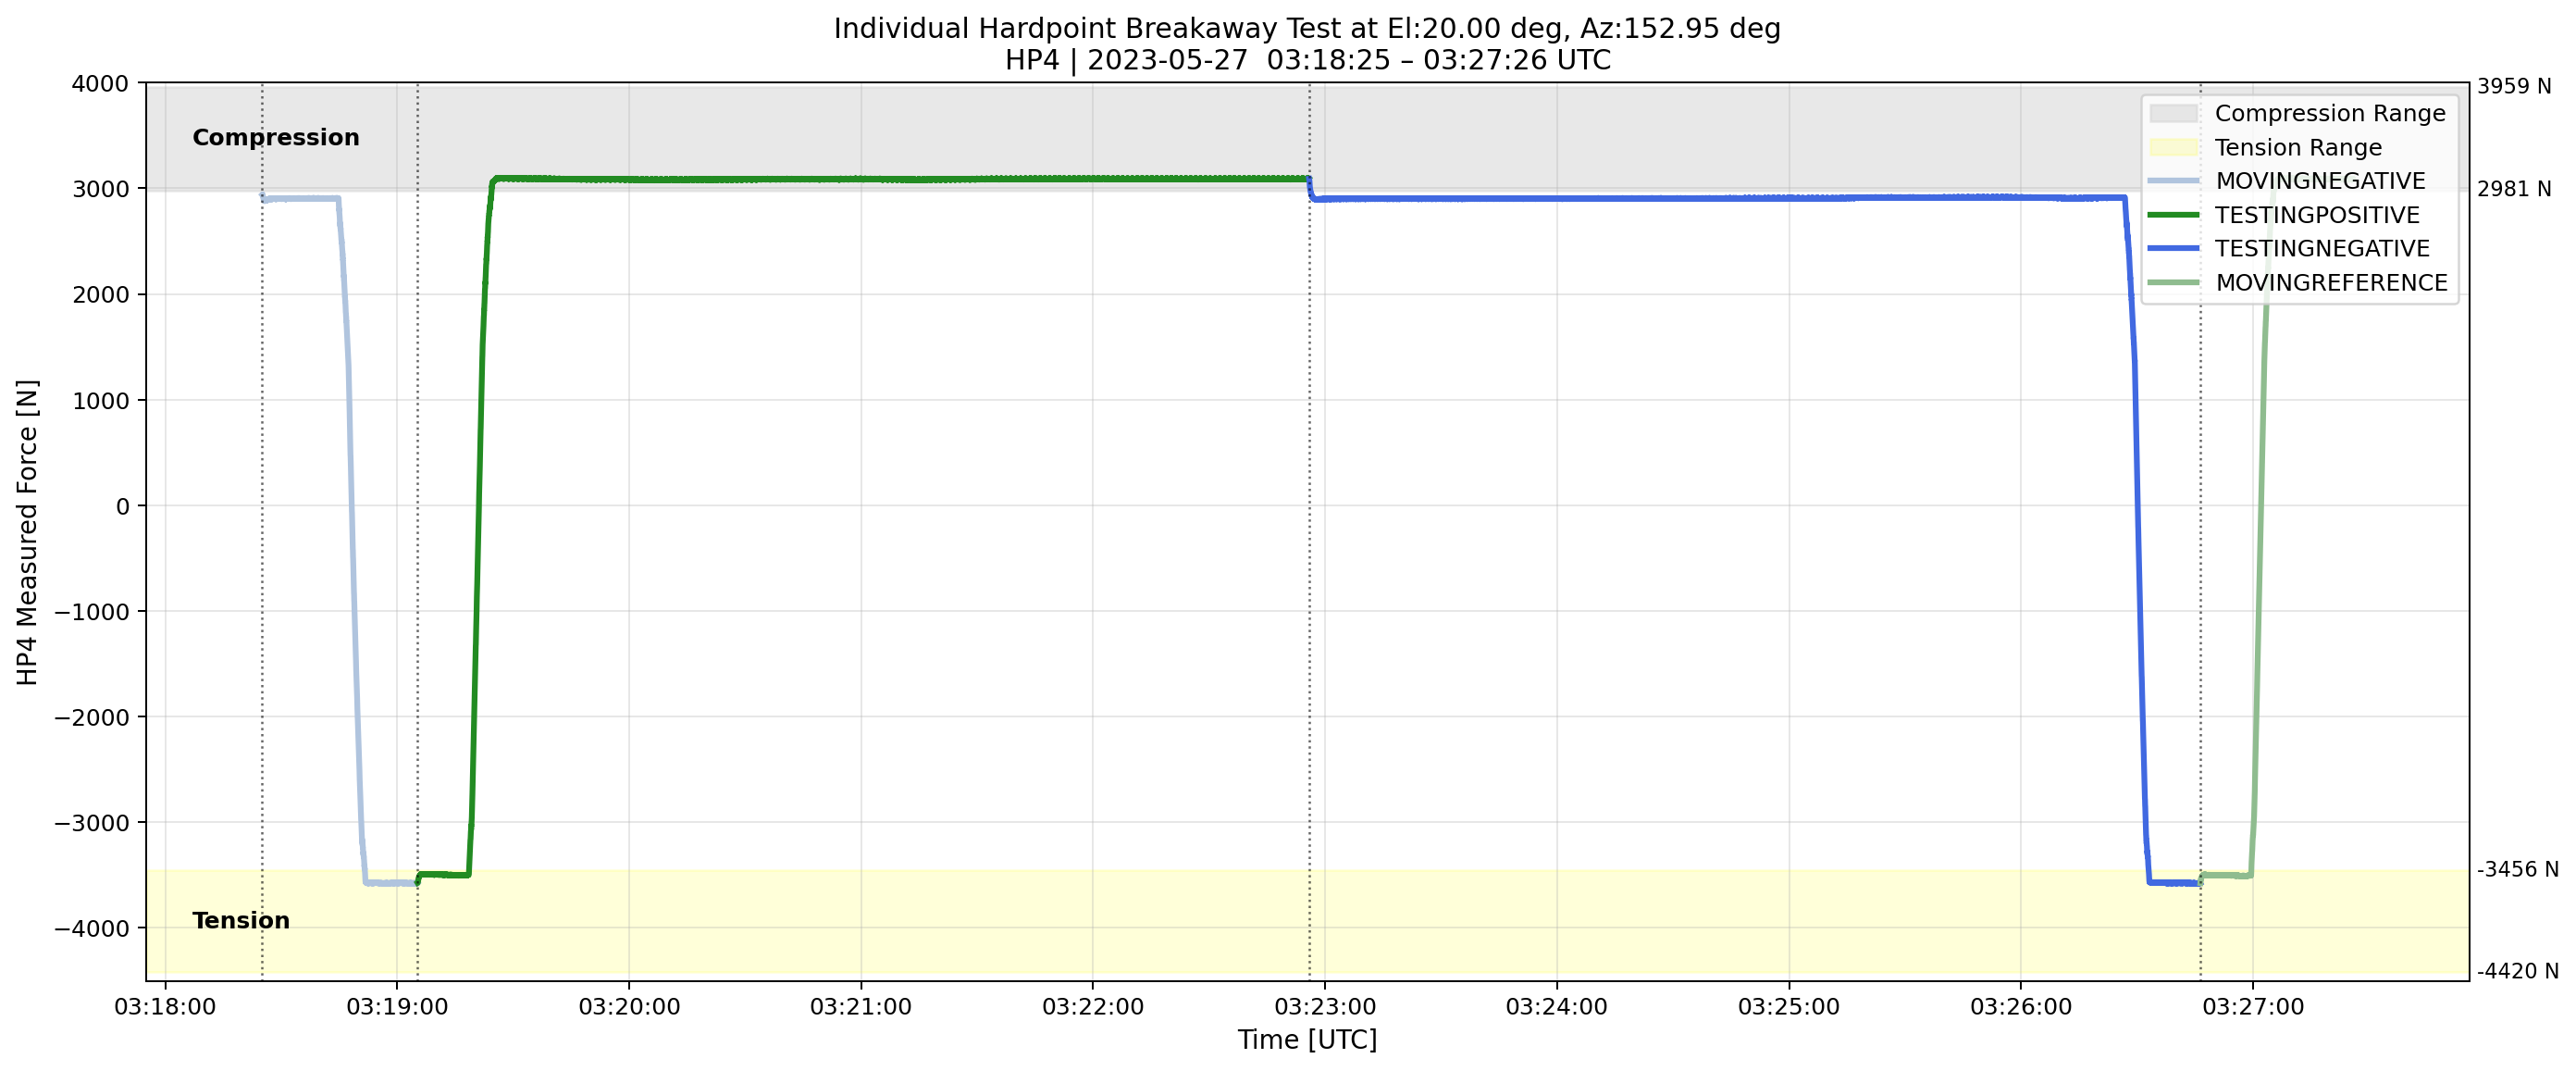
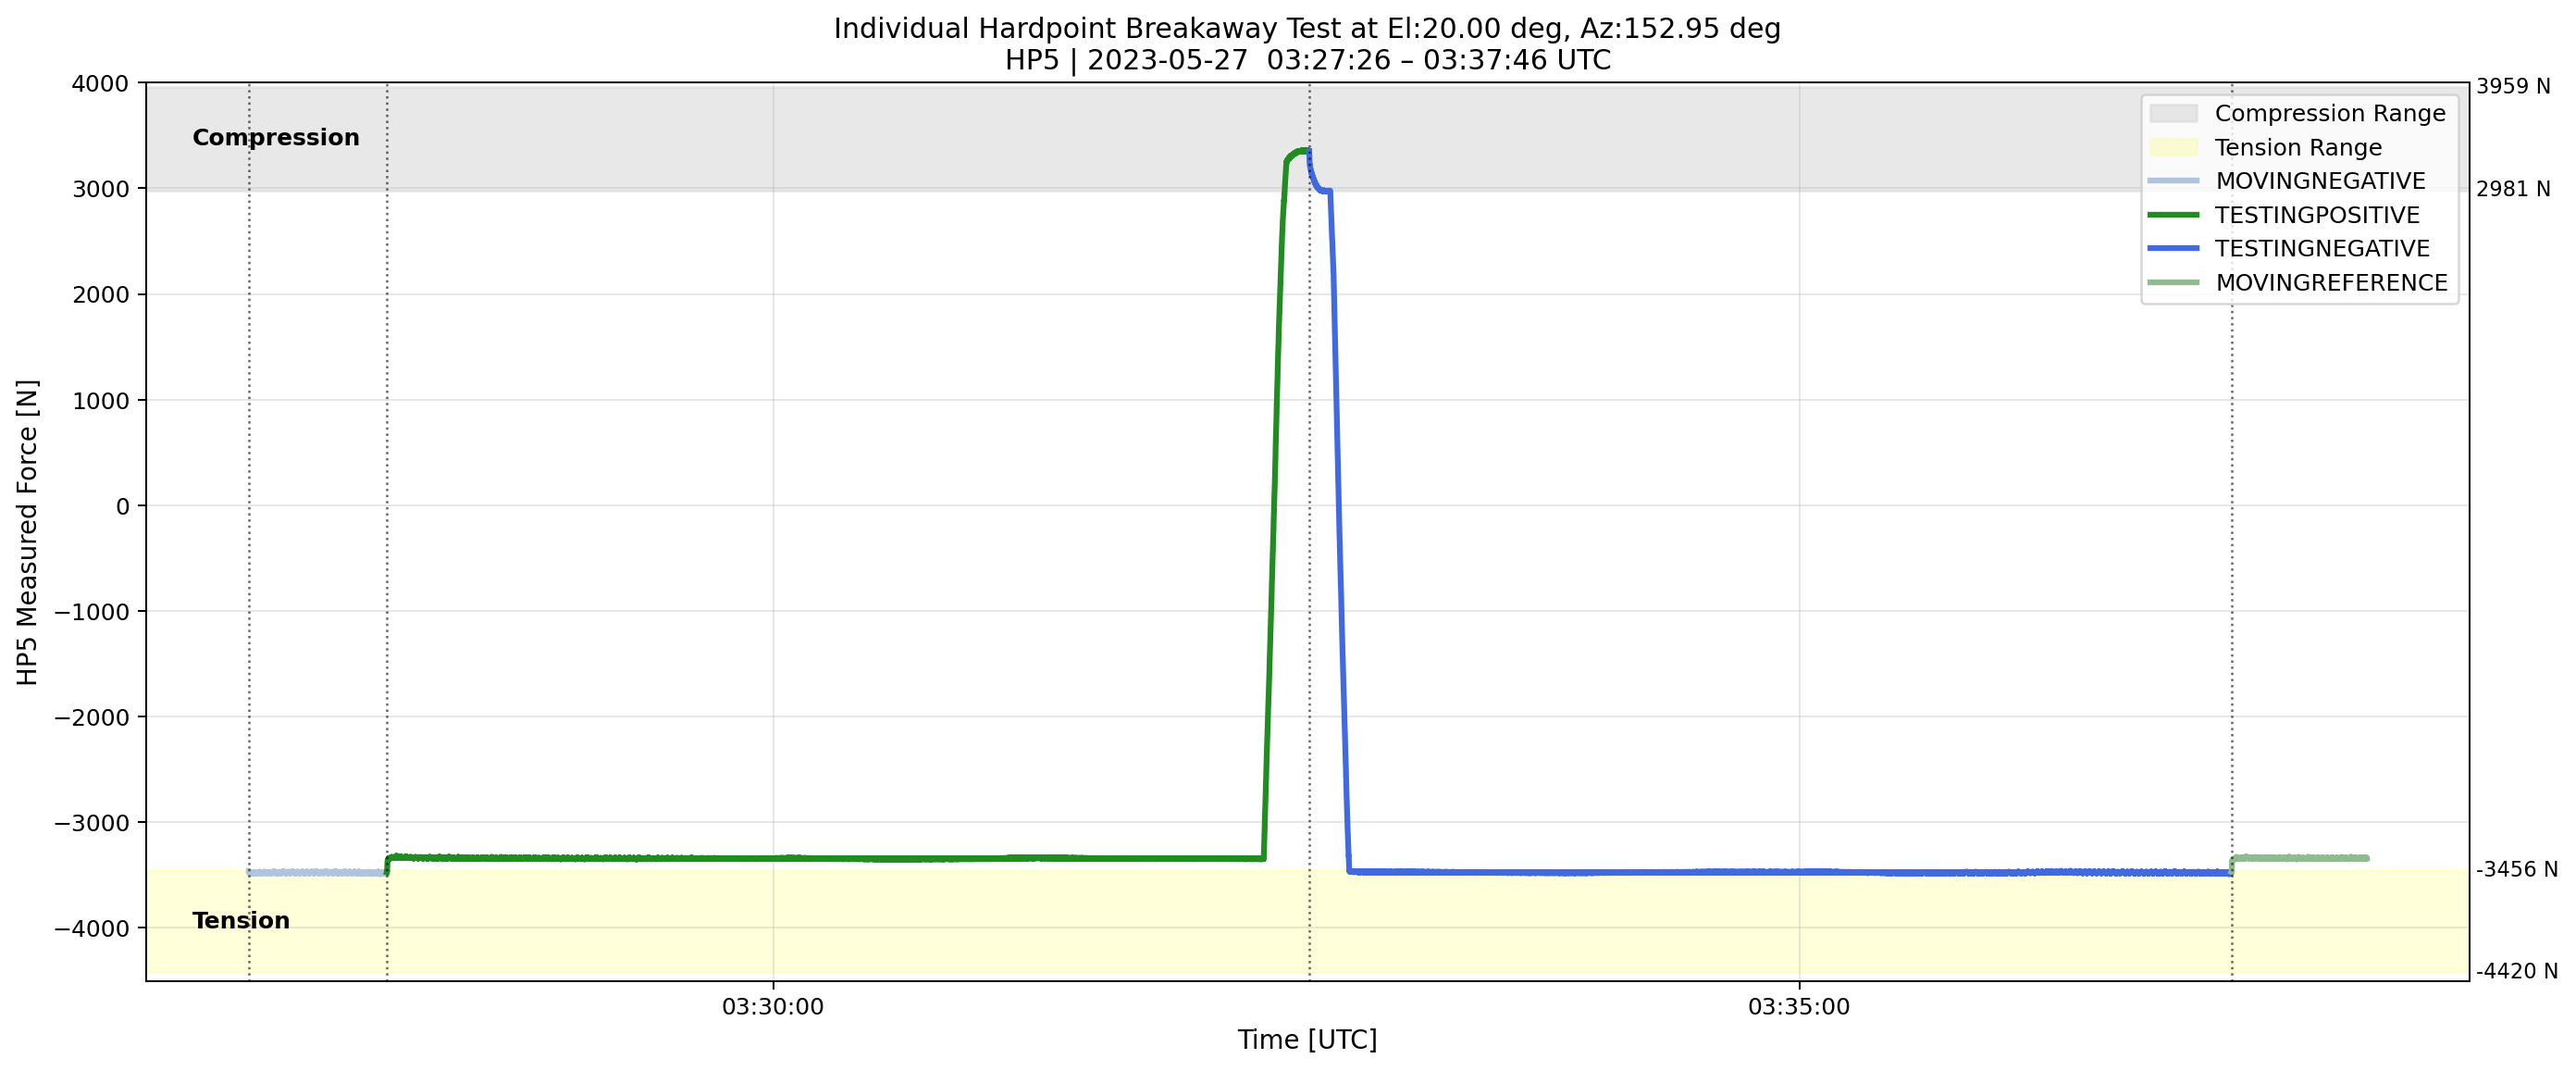
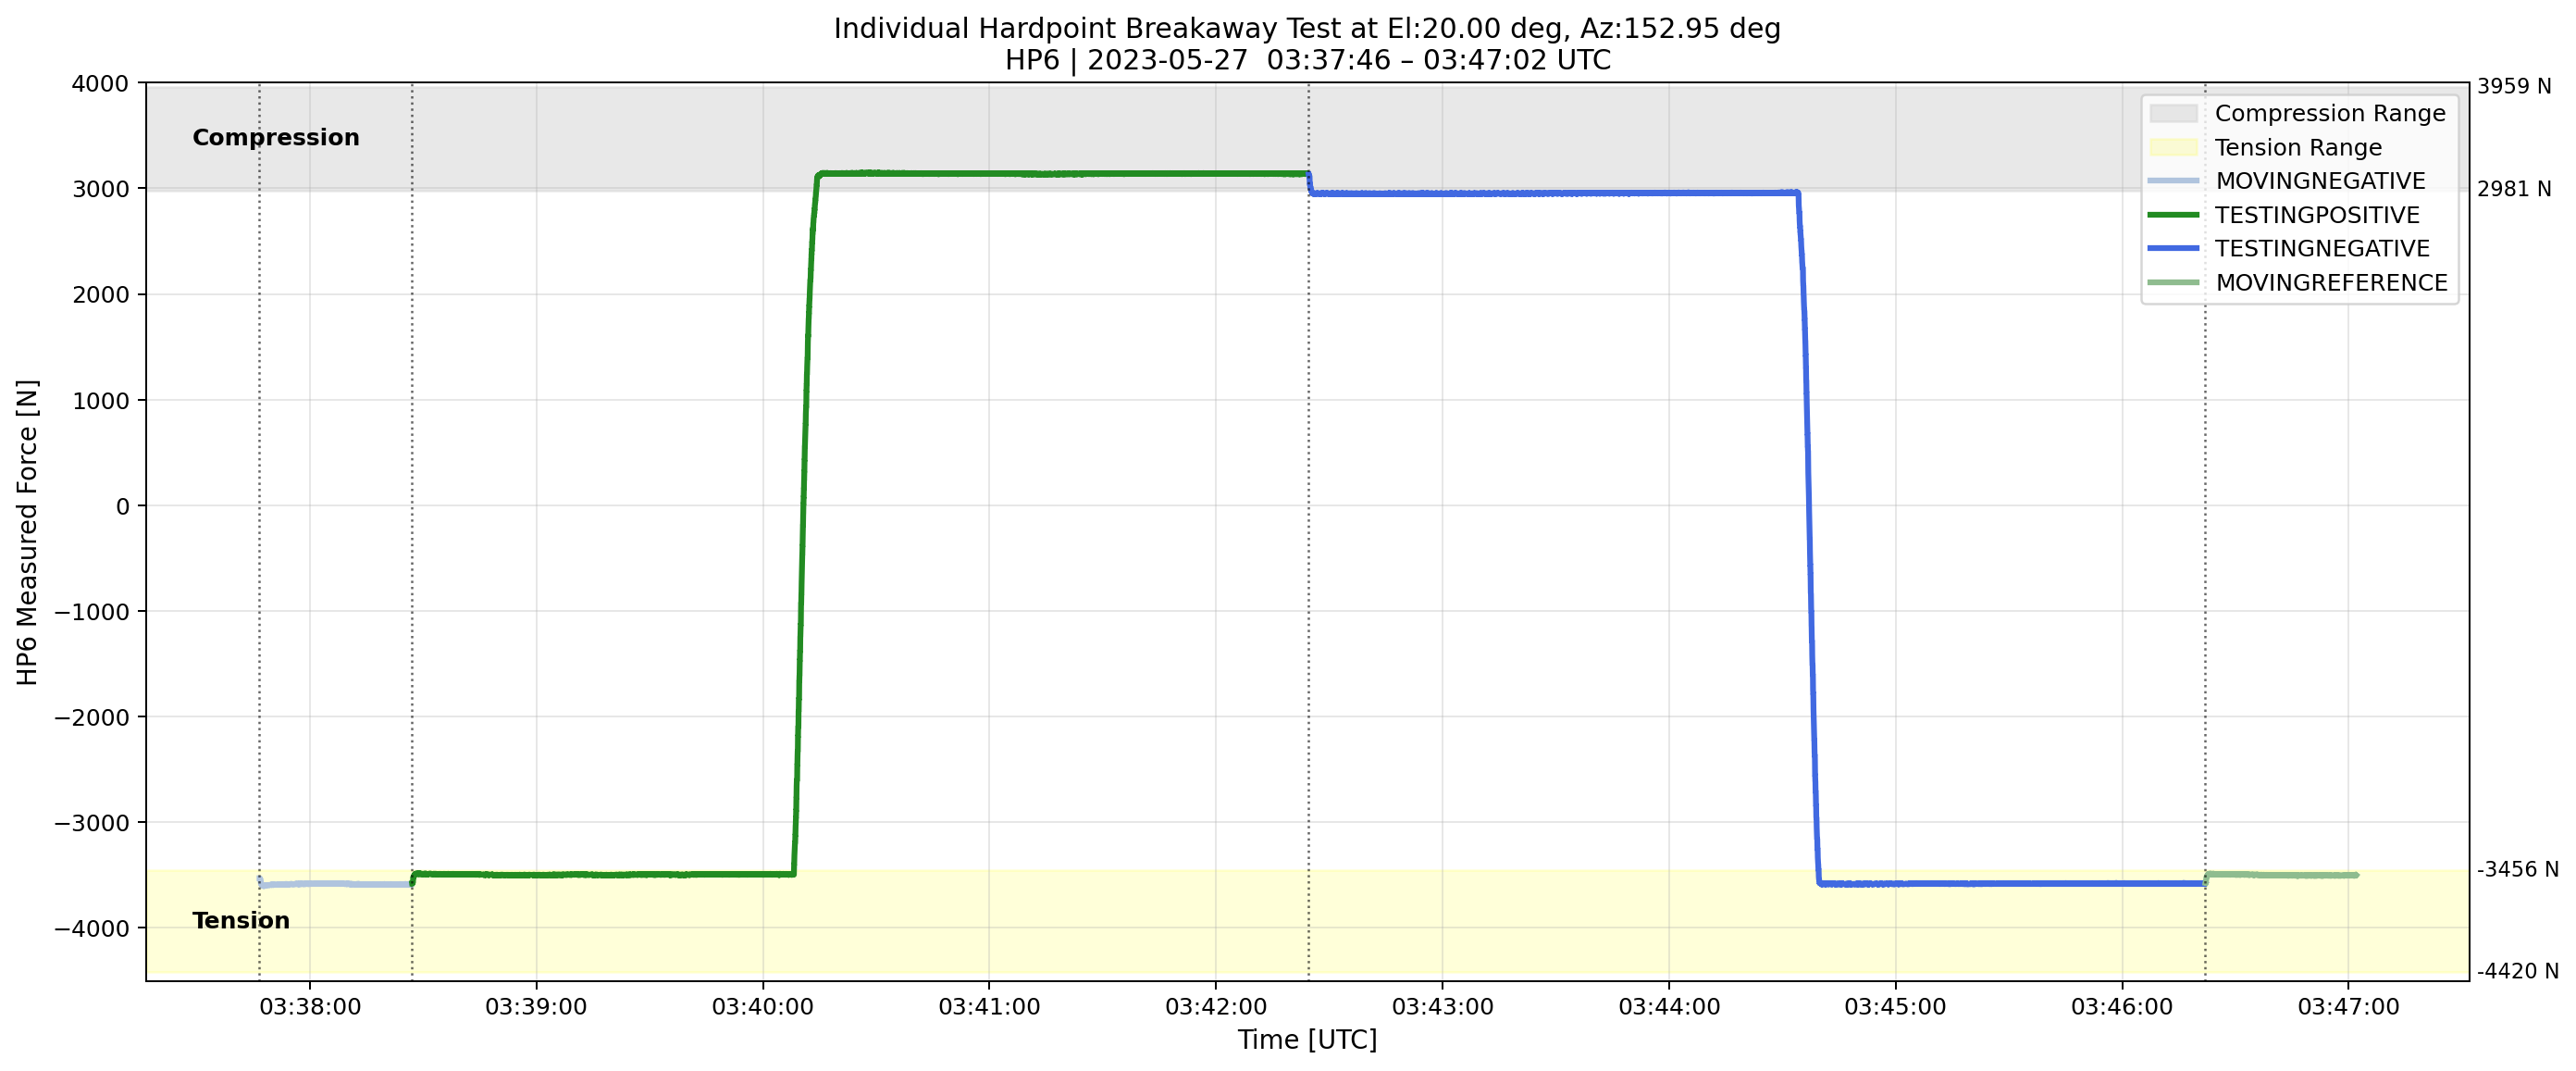
Fig. 10 Transition of the measured forces on each hardpoint when the TMA is at el=20deg.#
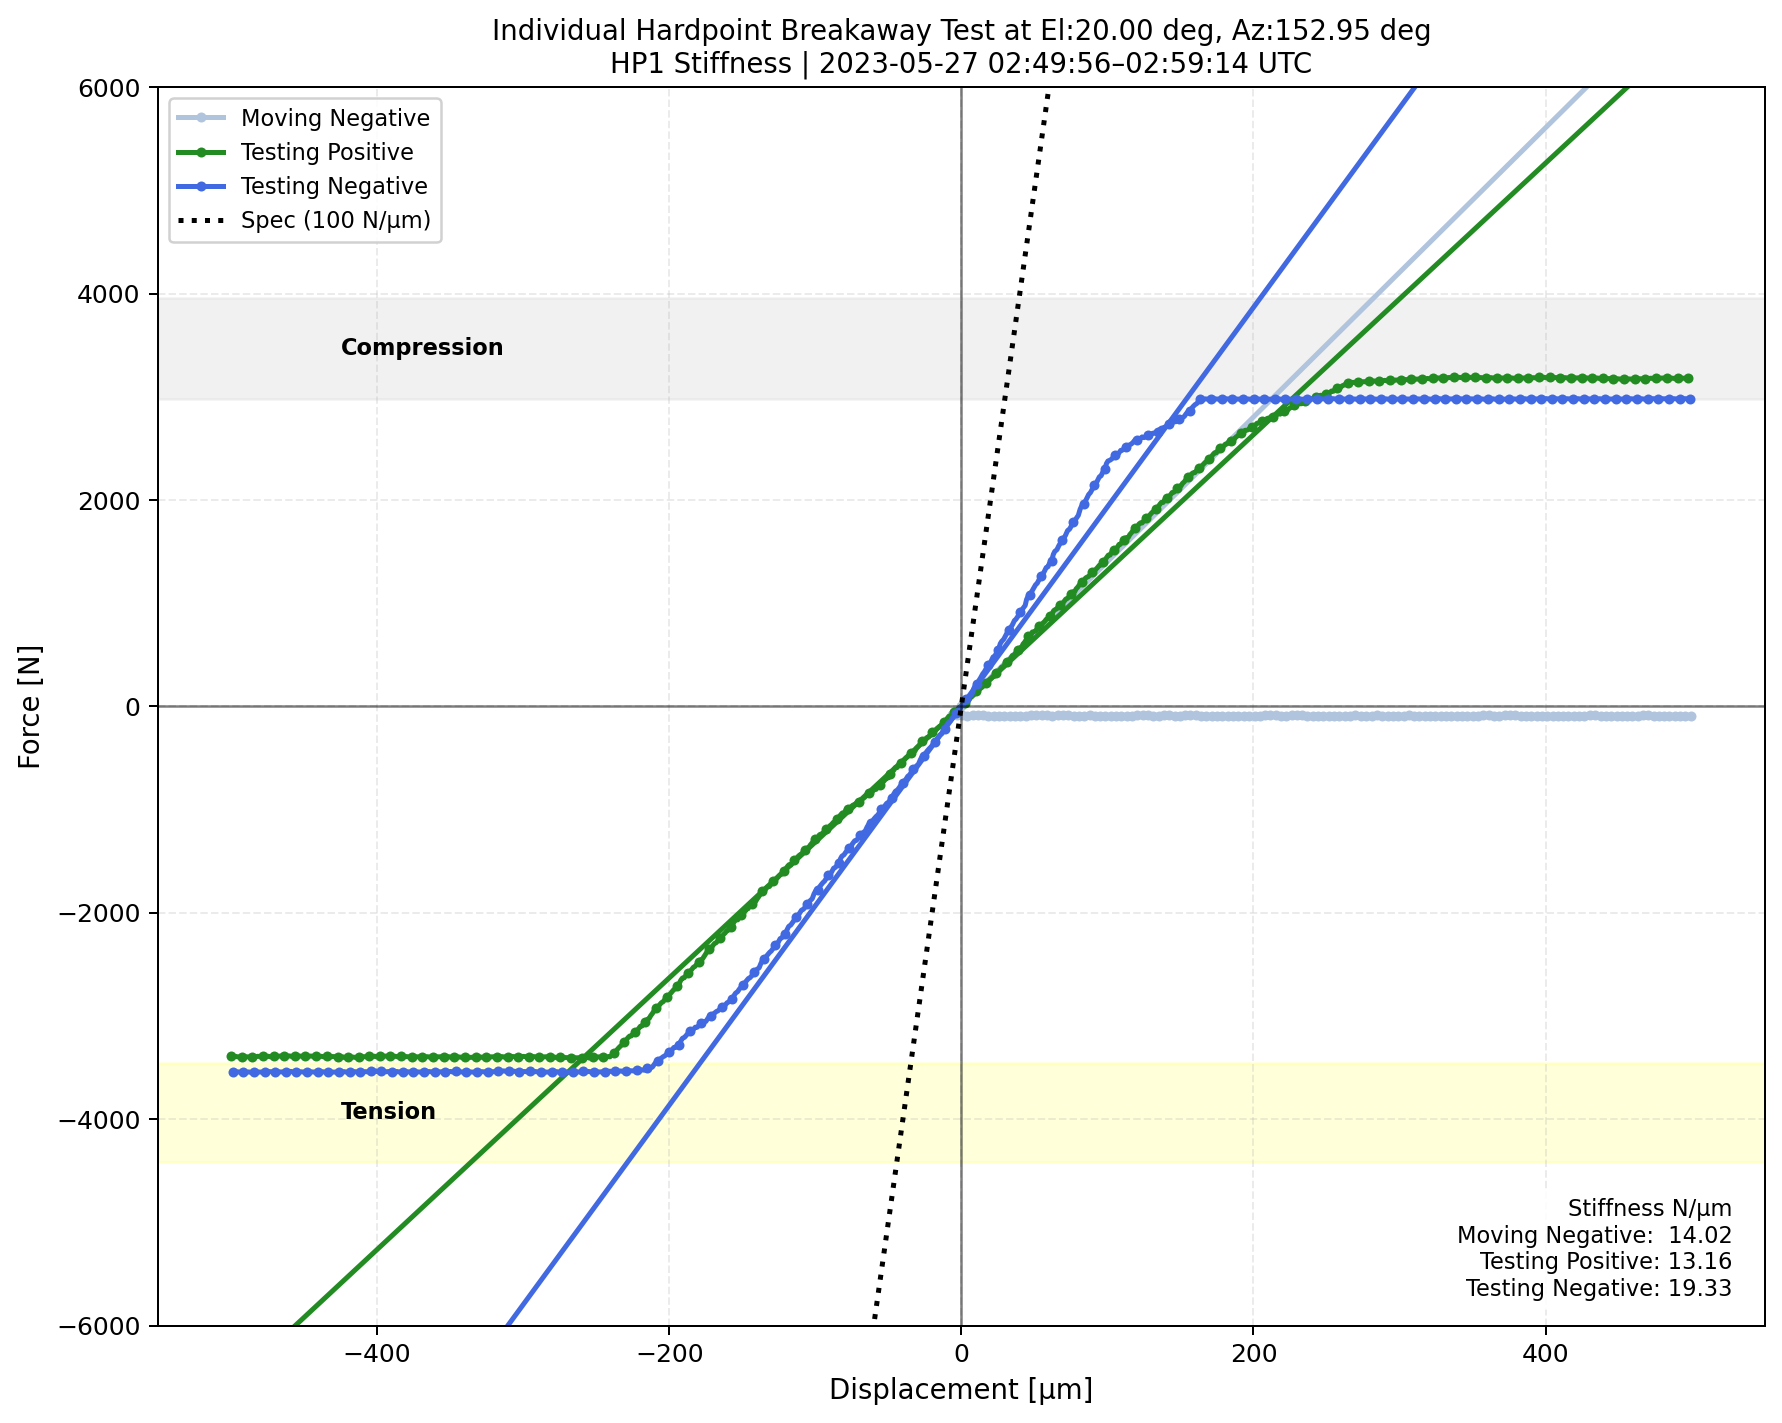
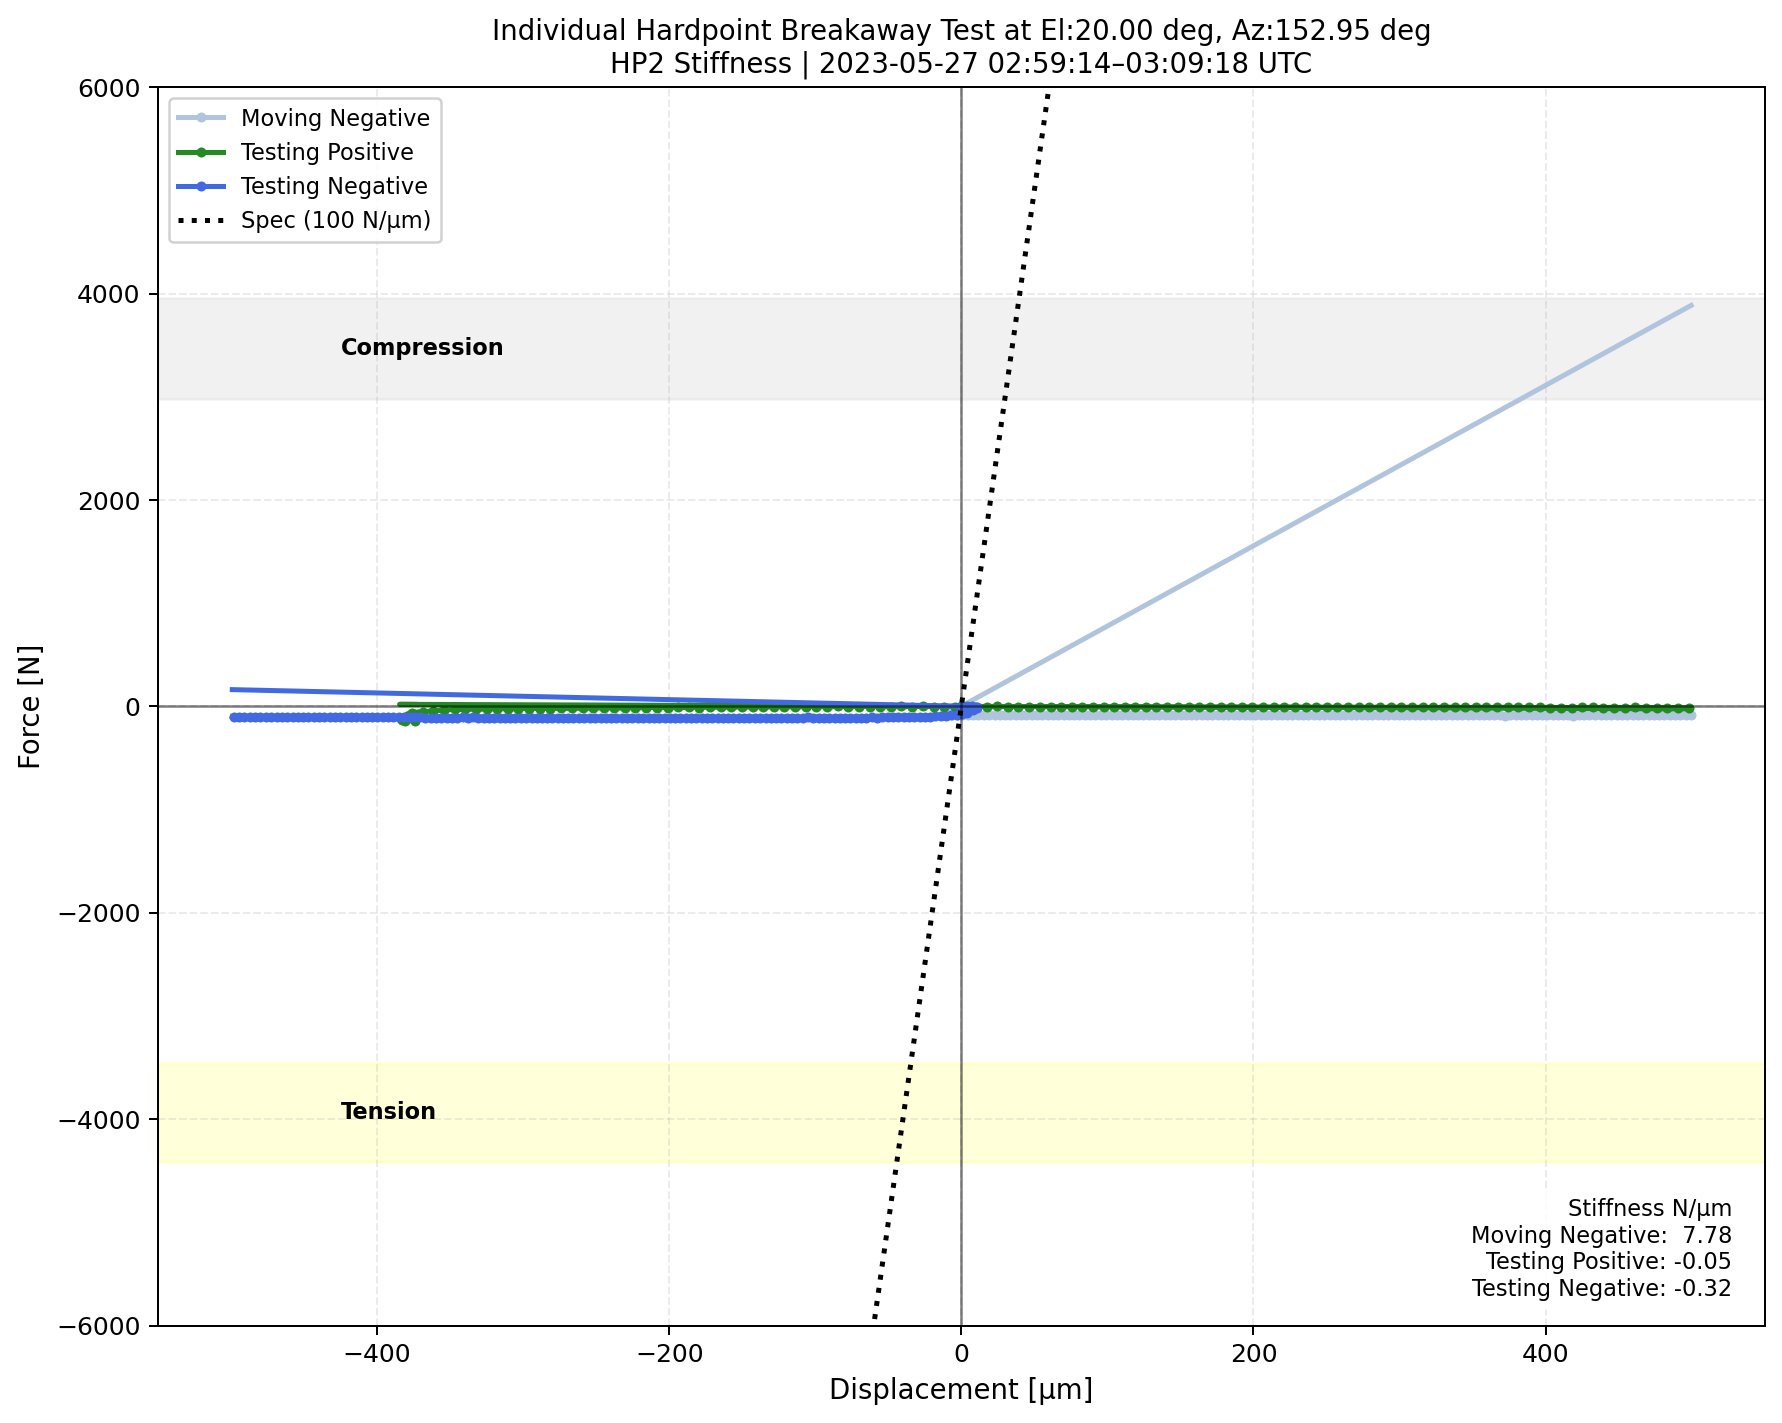


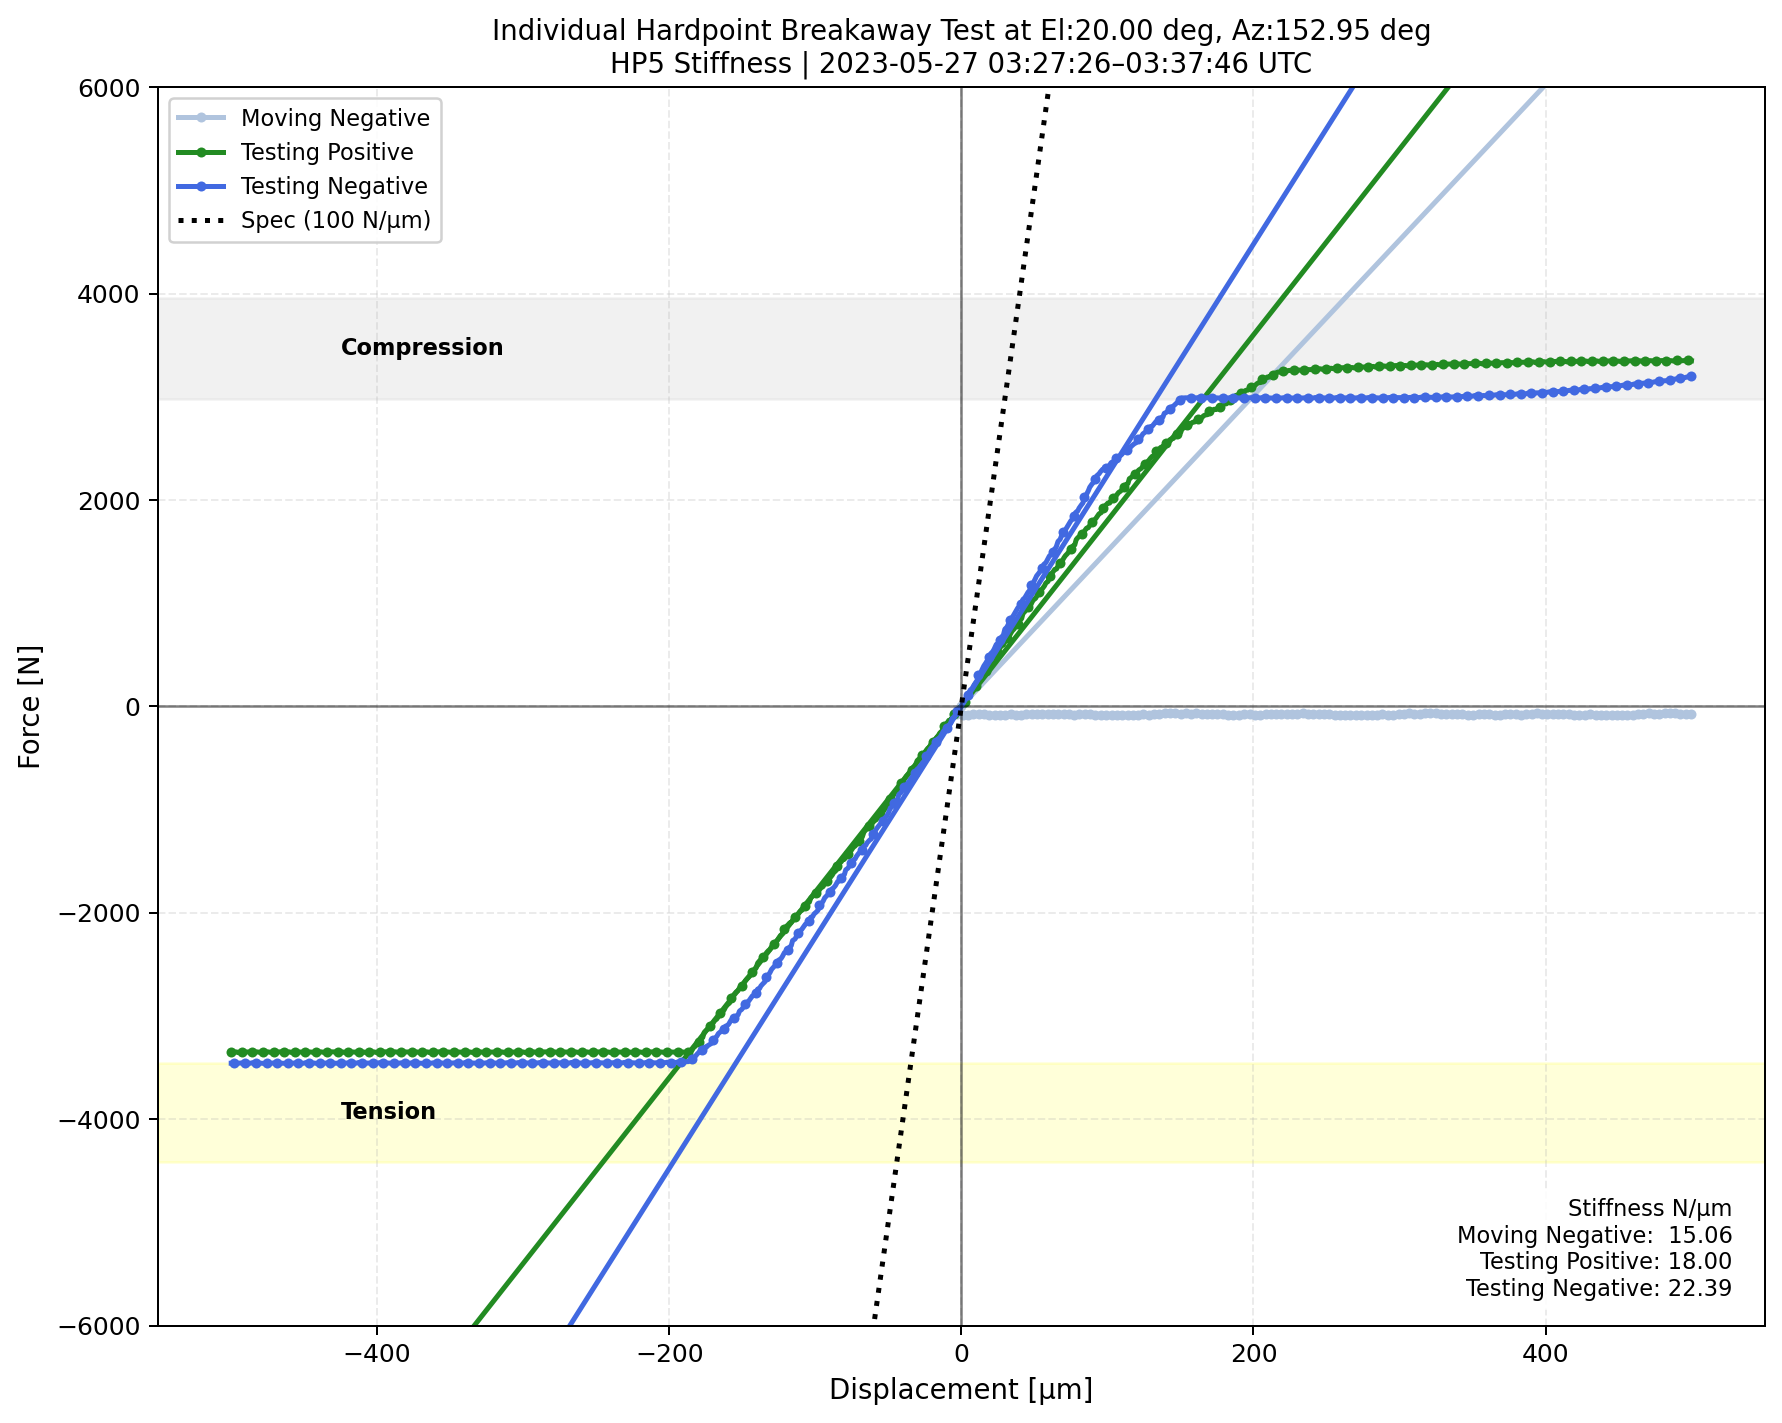
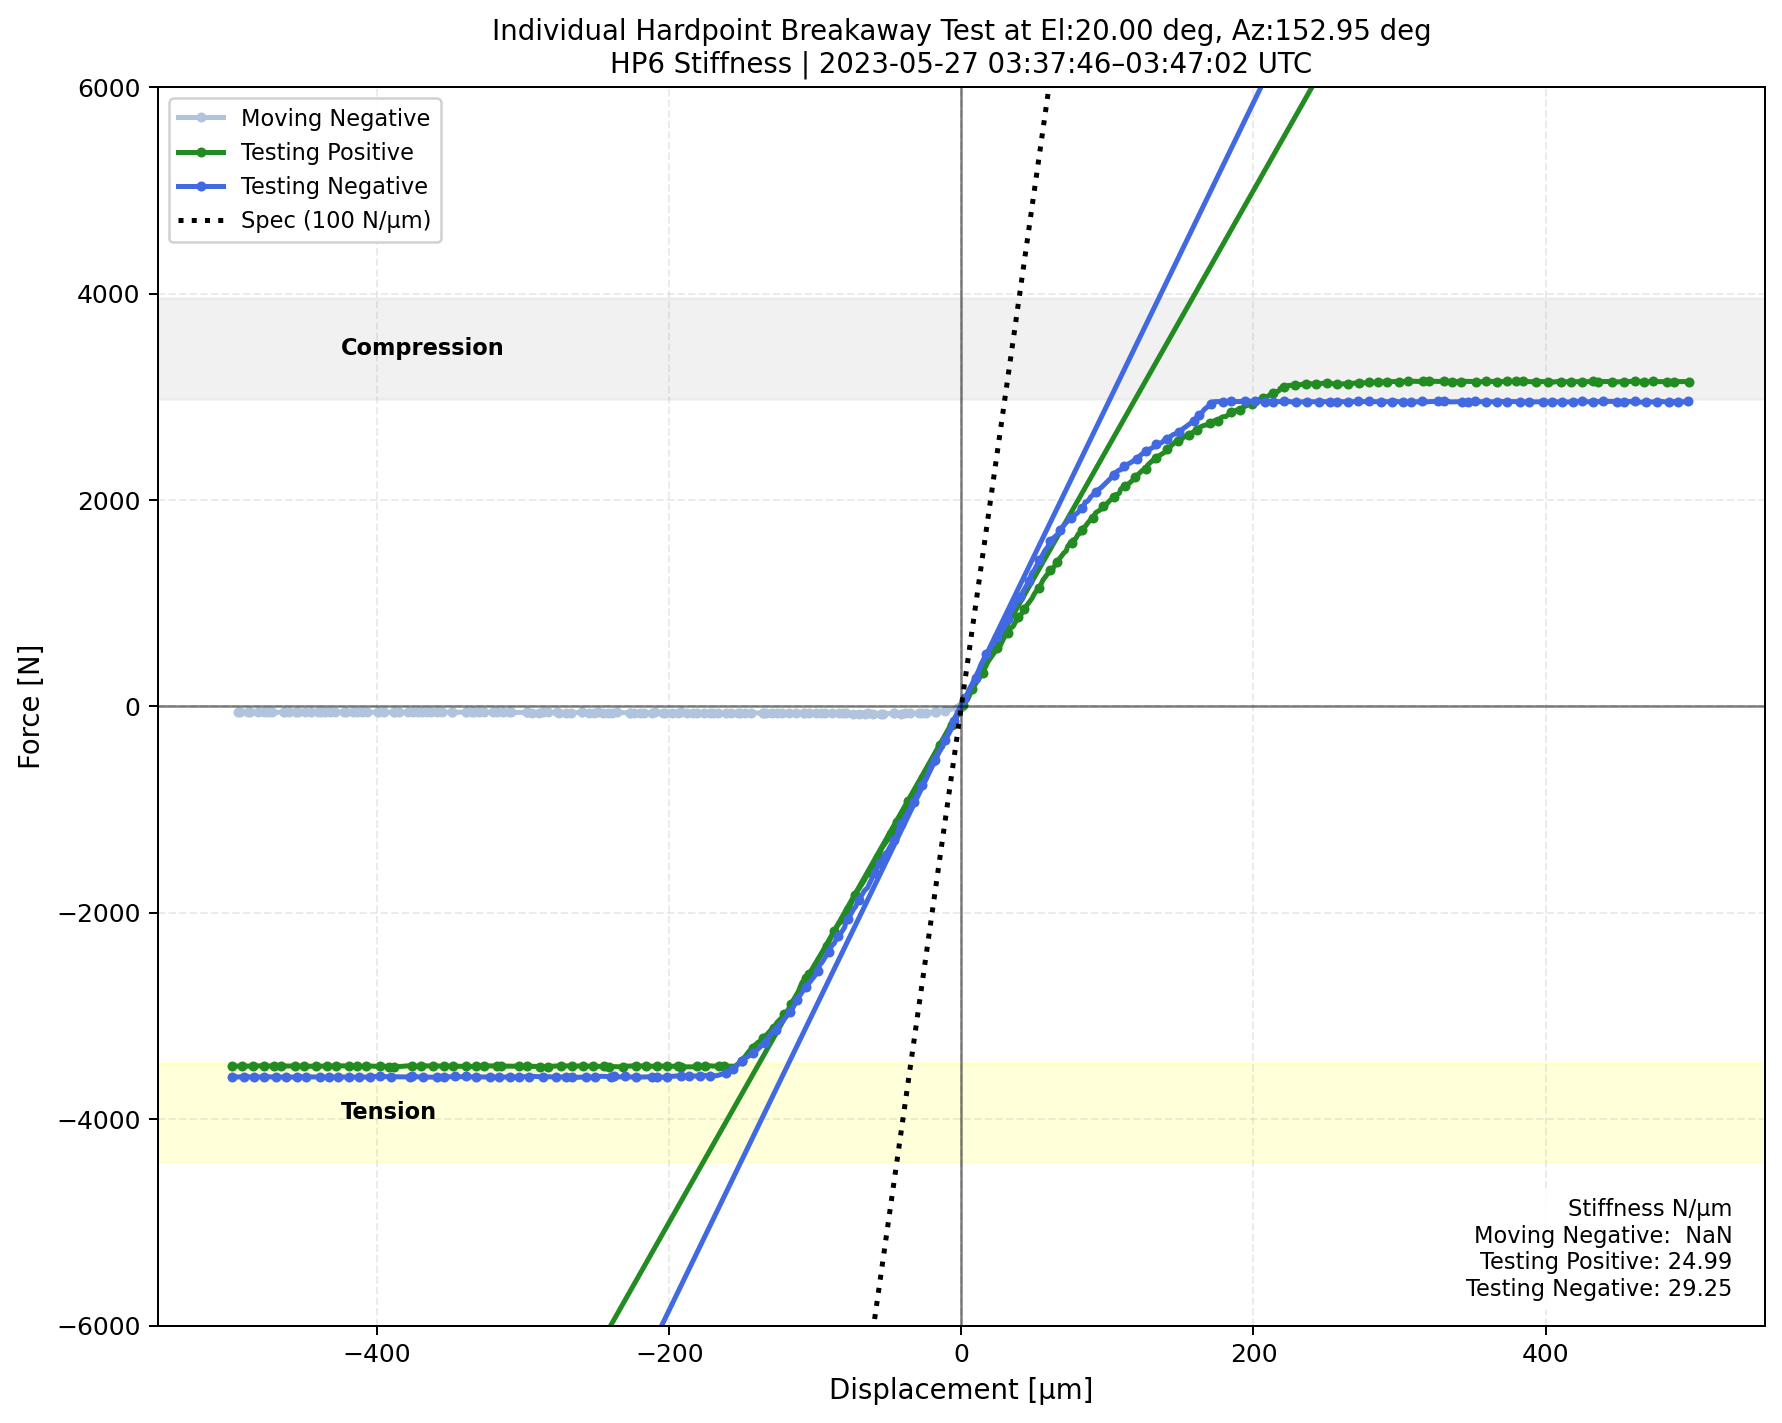
Fig. 11 <math>\Delta</math>Displacement versus measured forces for each phase during the hardpoint breakaway test when the TMA is at el=20 deg.#
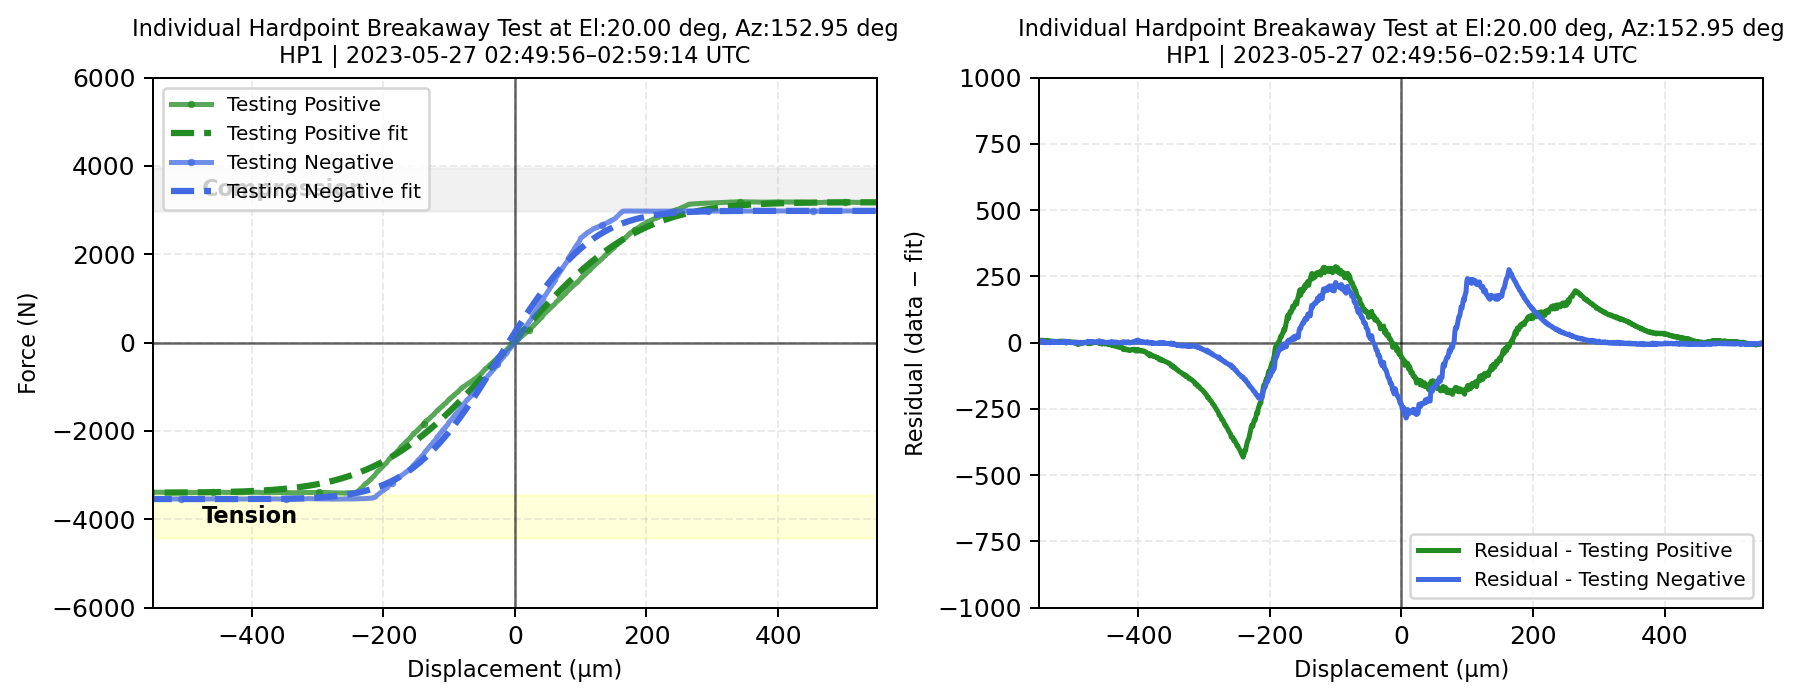
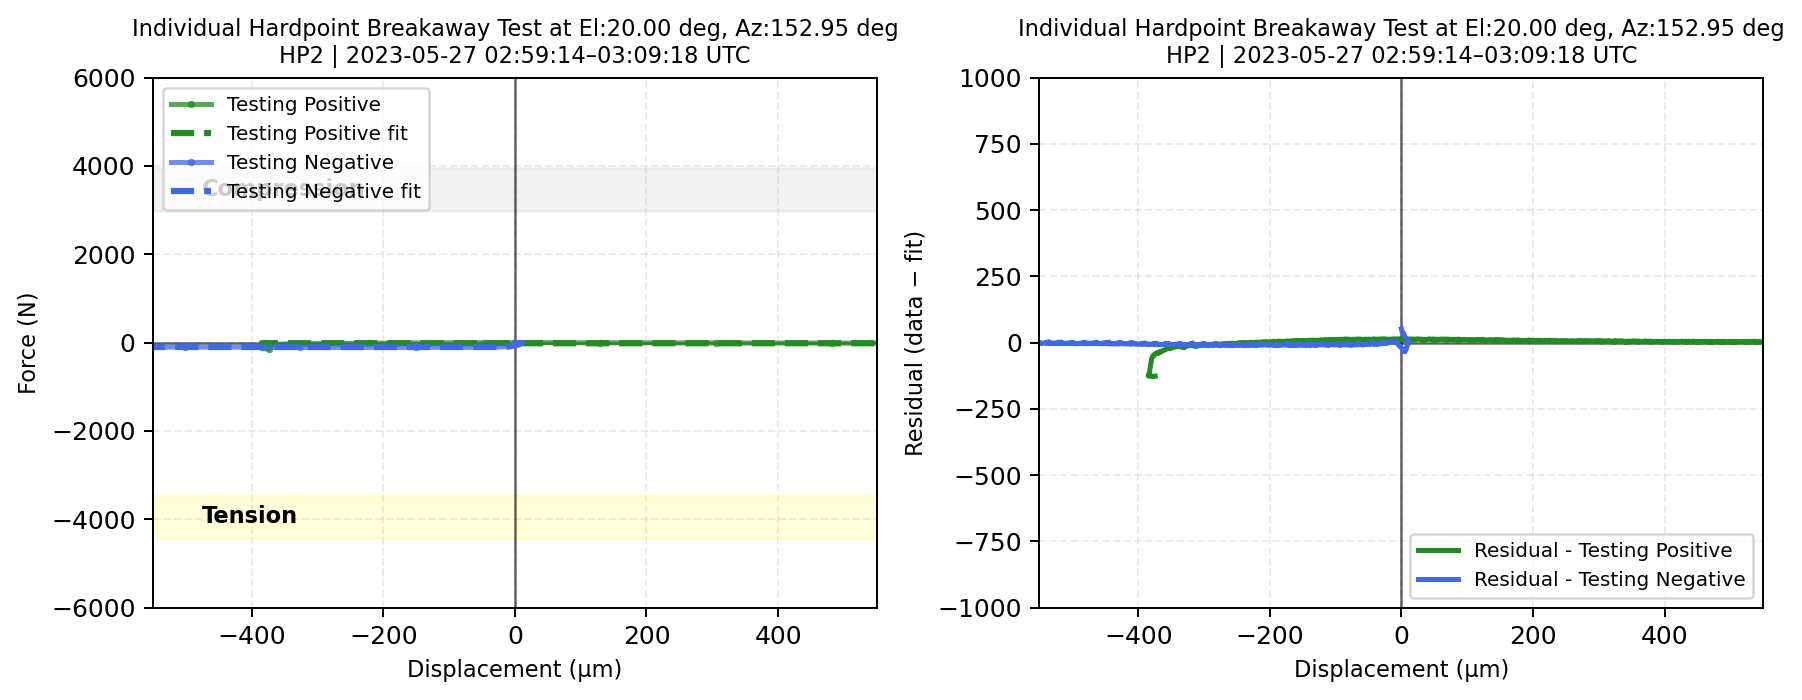

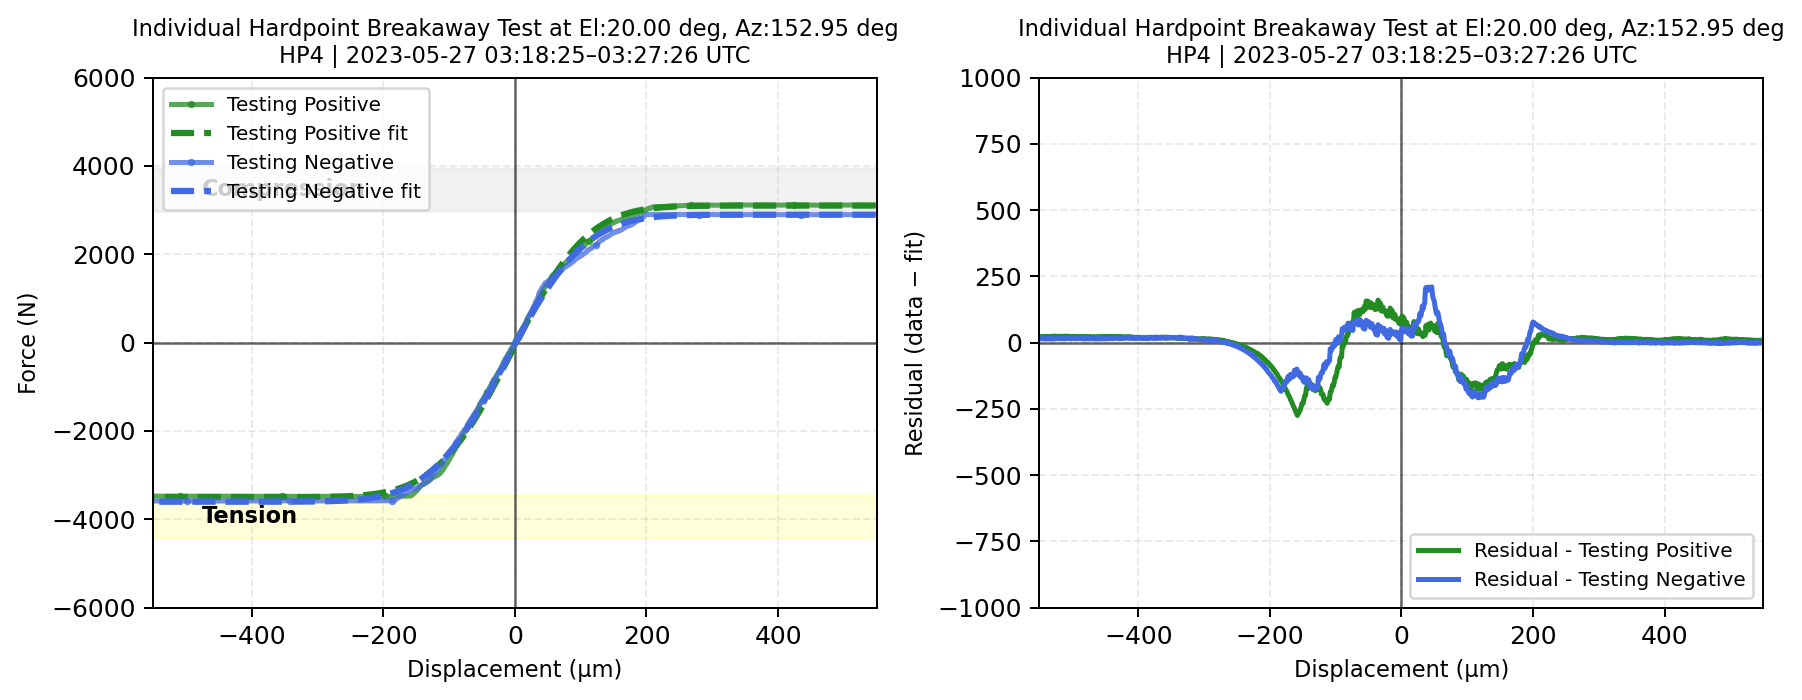
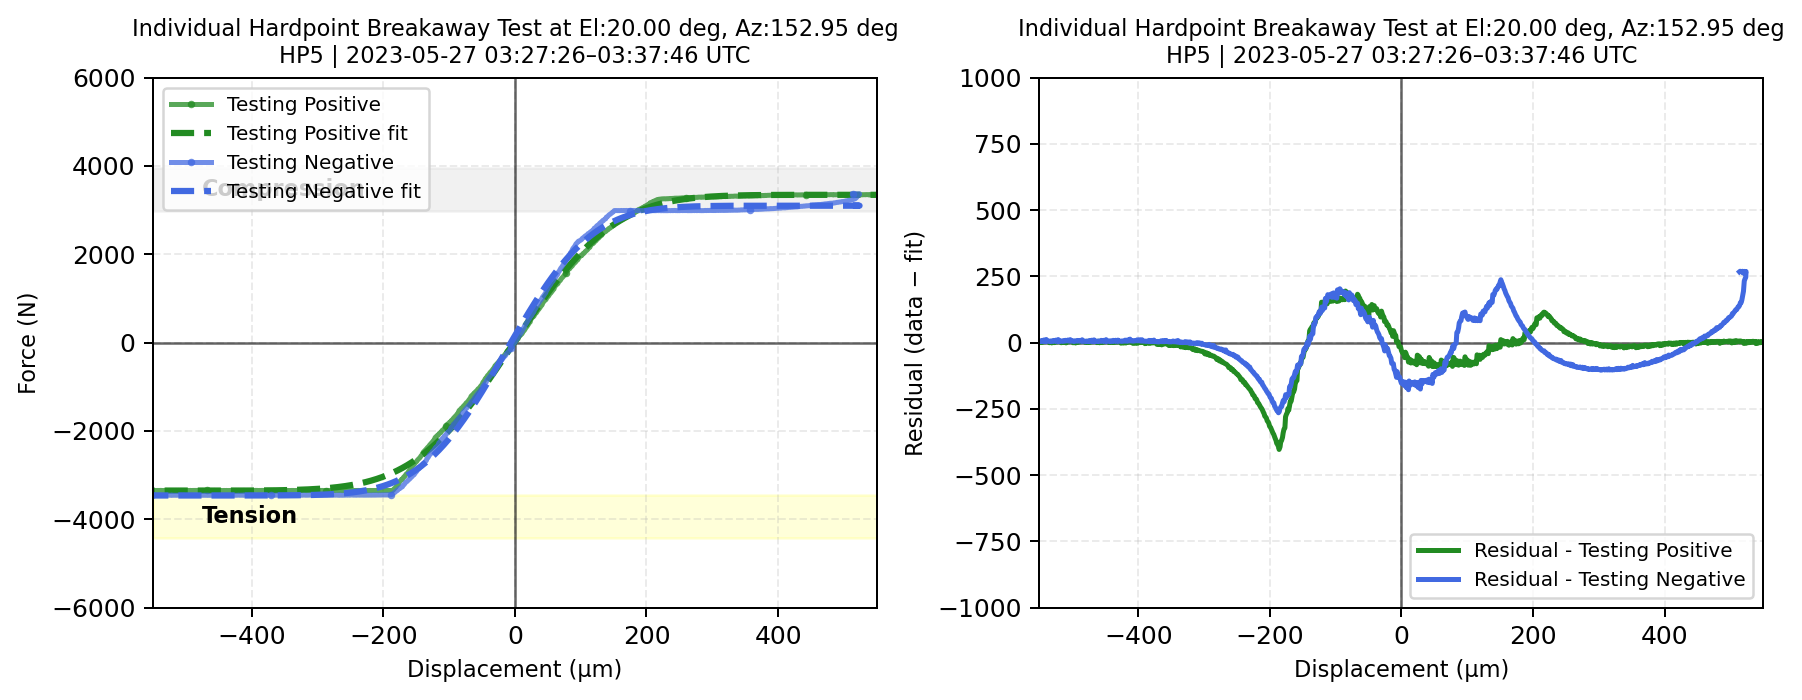
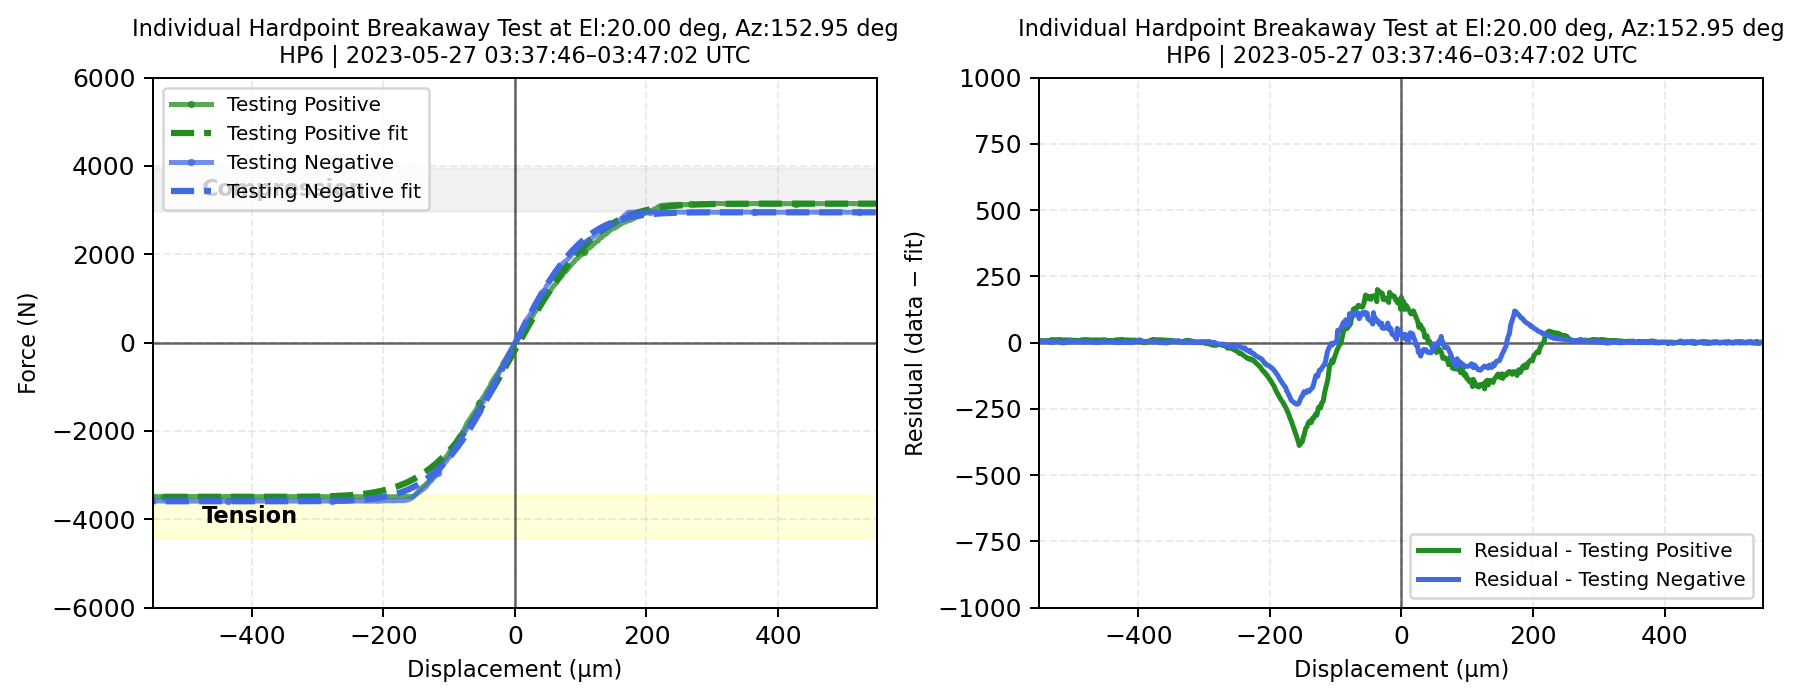
Fig. 12 (Left) \(\Delta\)Displacement versus measured forces for each phase during the hardpoint breakaway test fit with error function (the TMA at el=20deg). (Right) The residual, a difference between data and error function, with respect to \(\Delta\)displacement#
HP Test at el 10 deg#
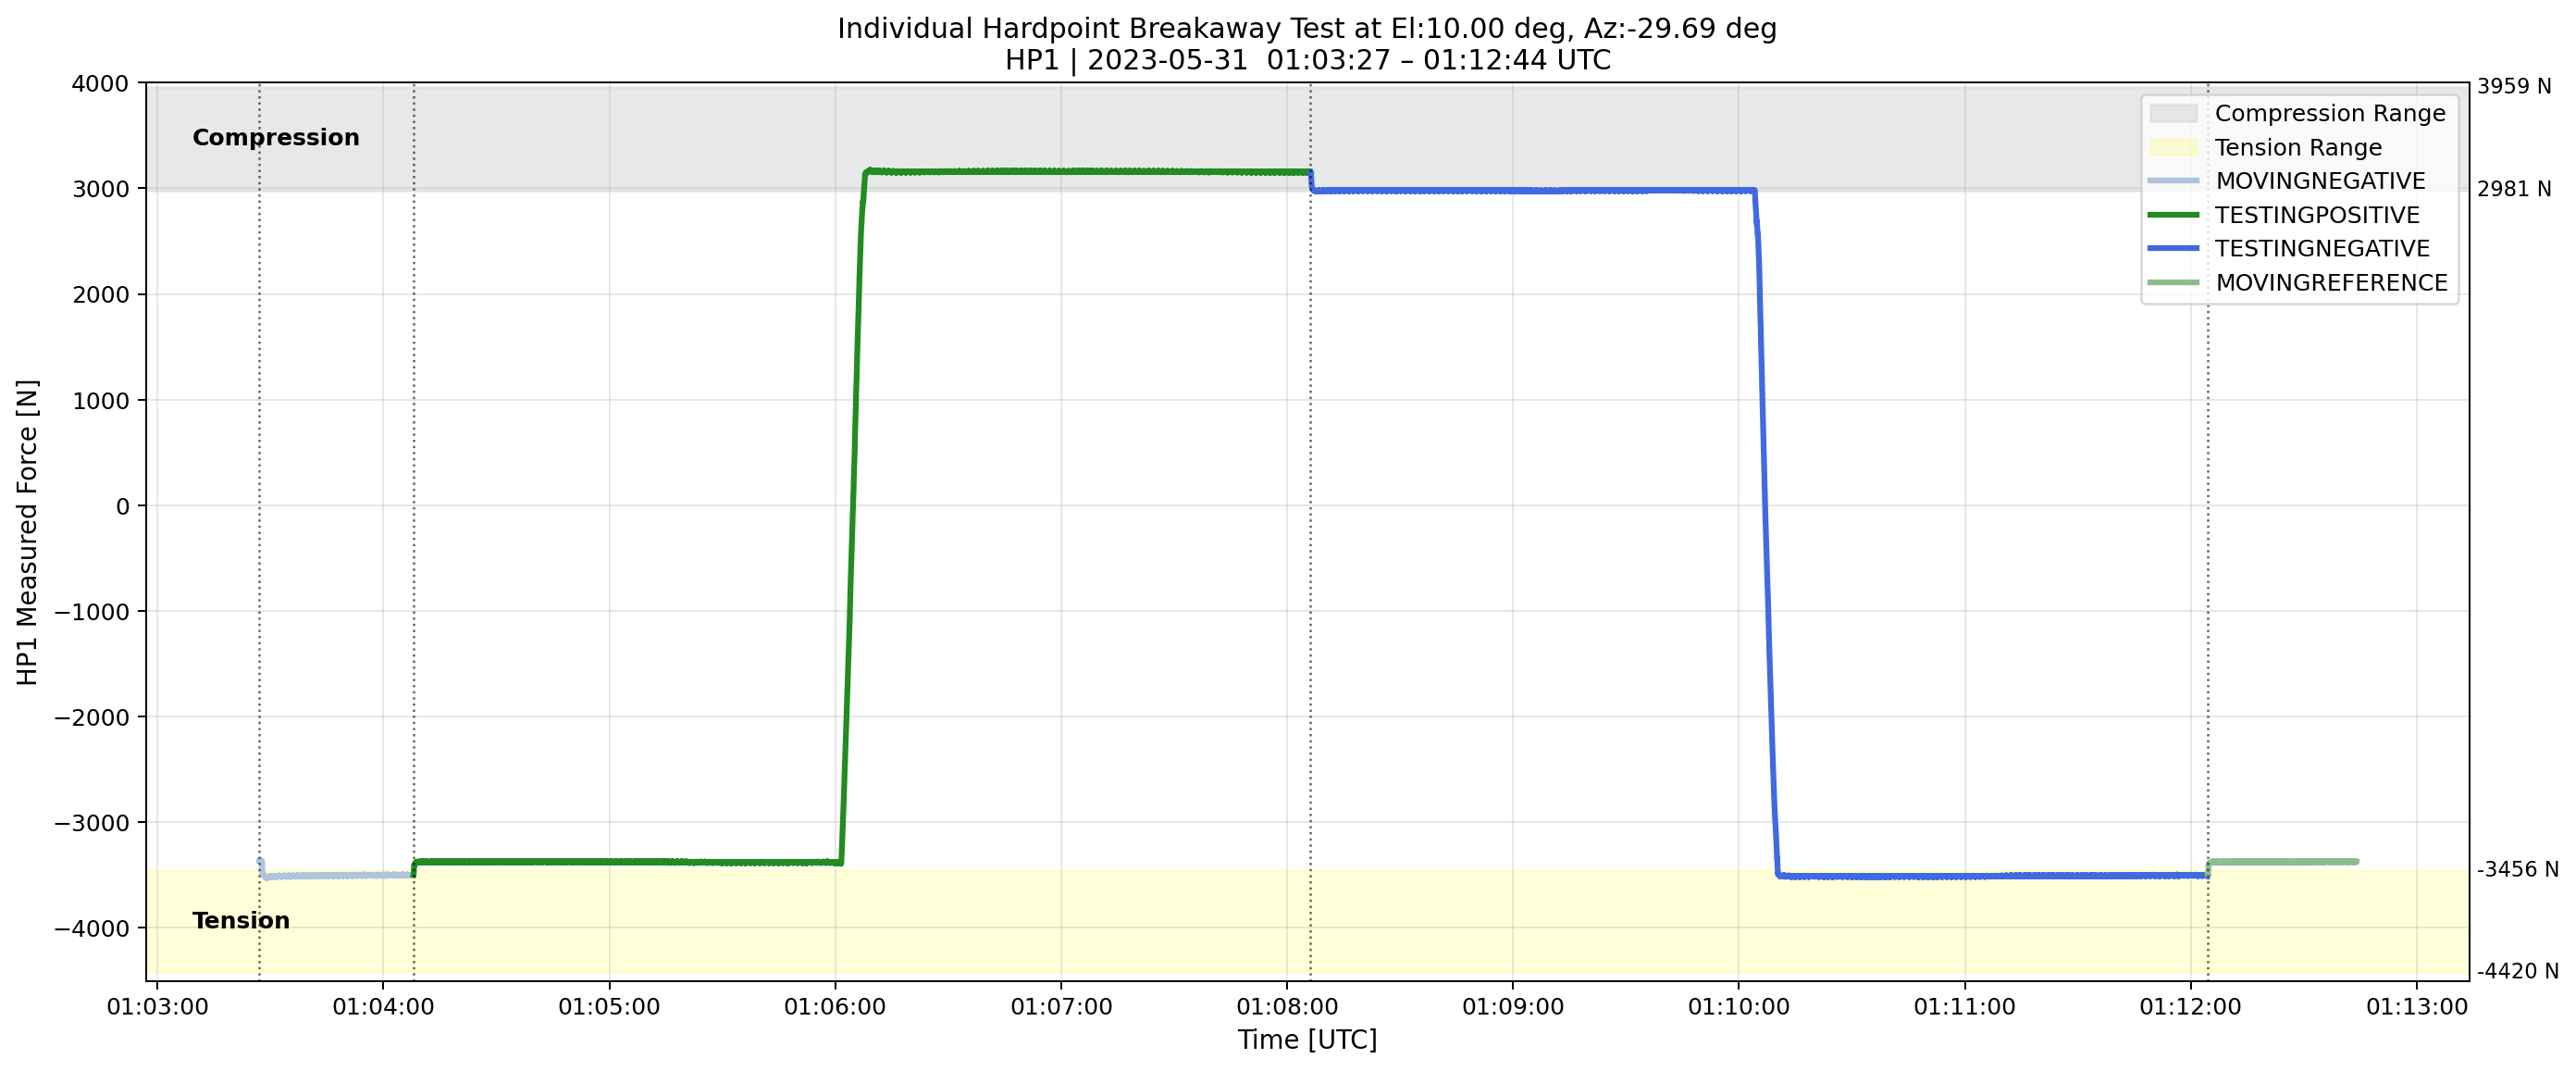
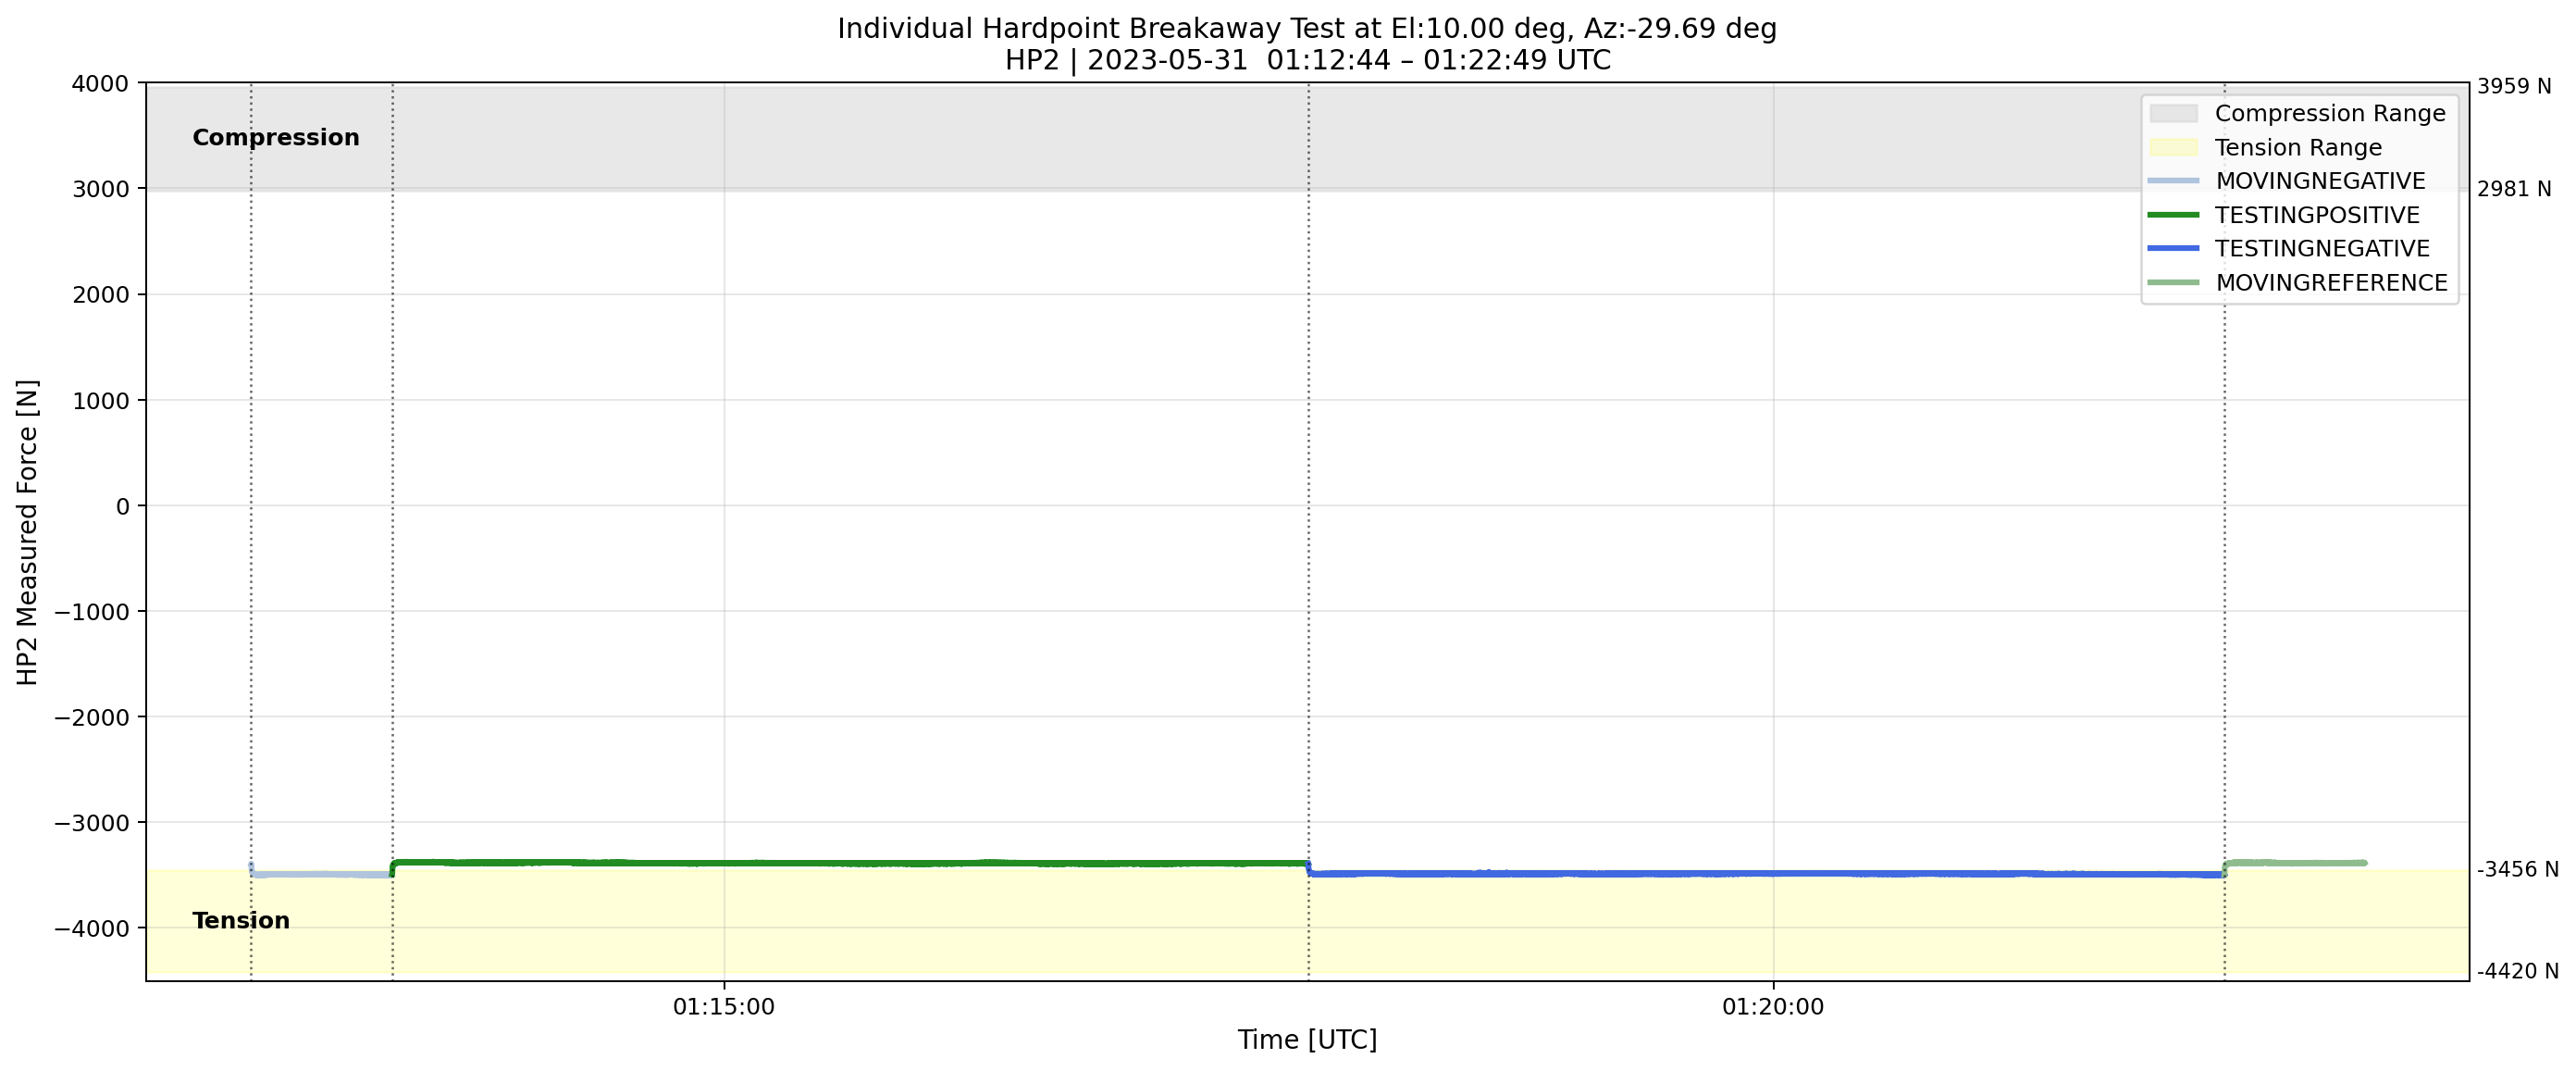
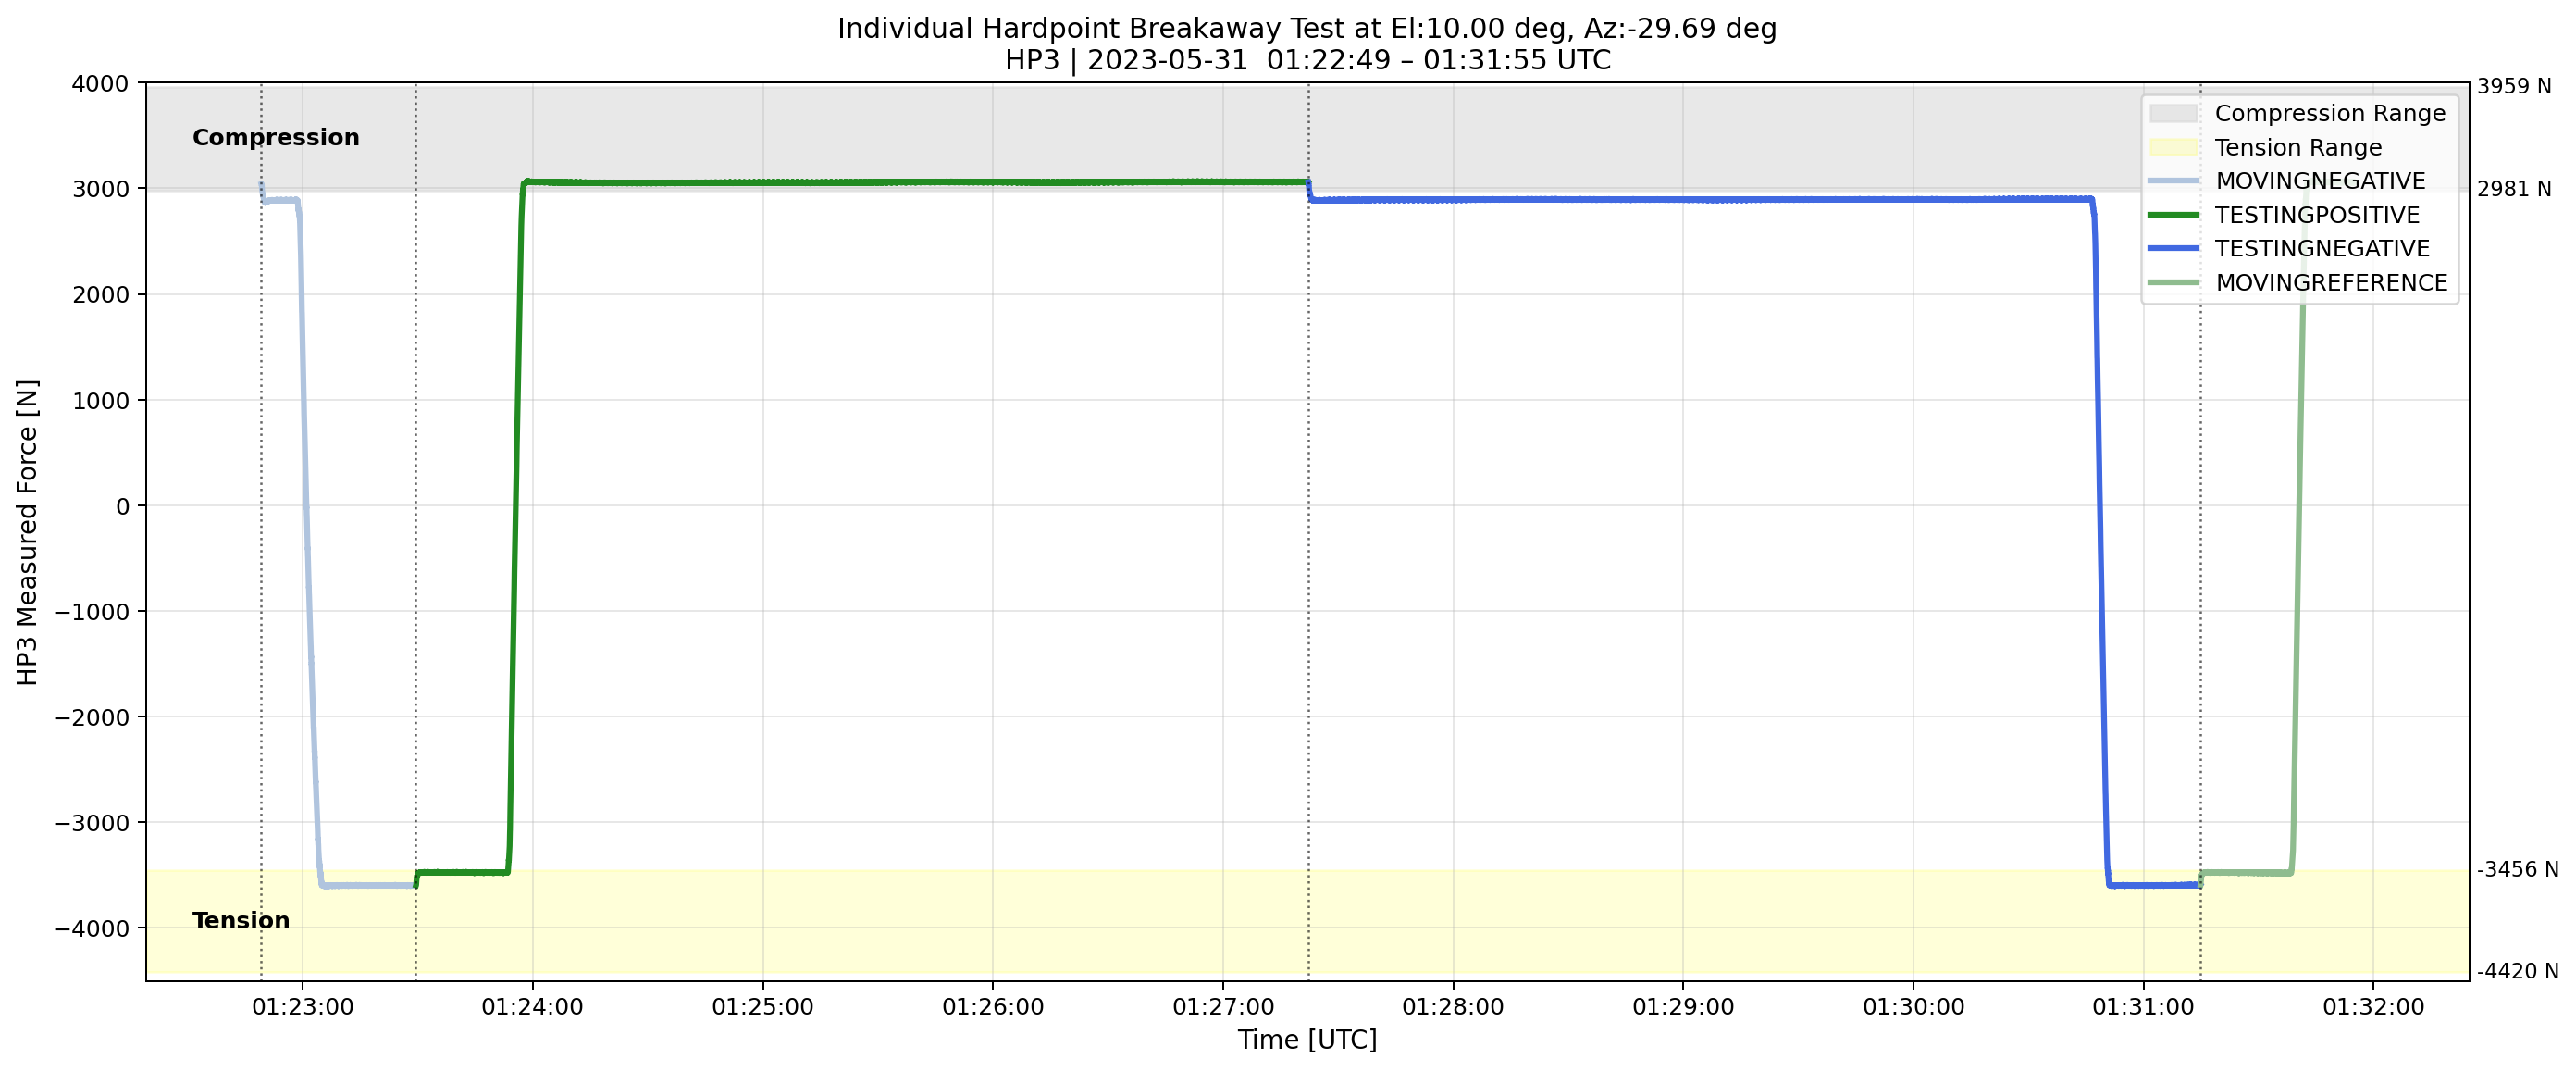
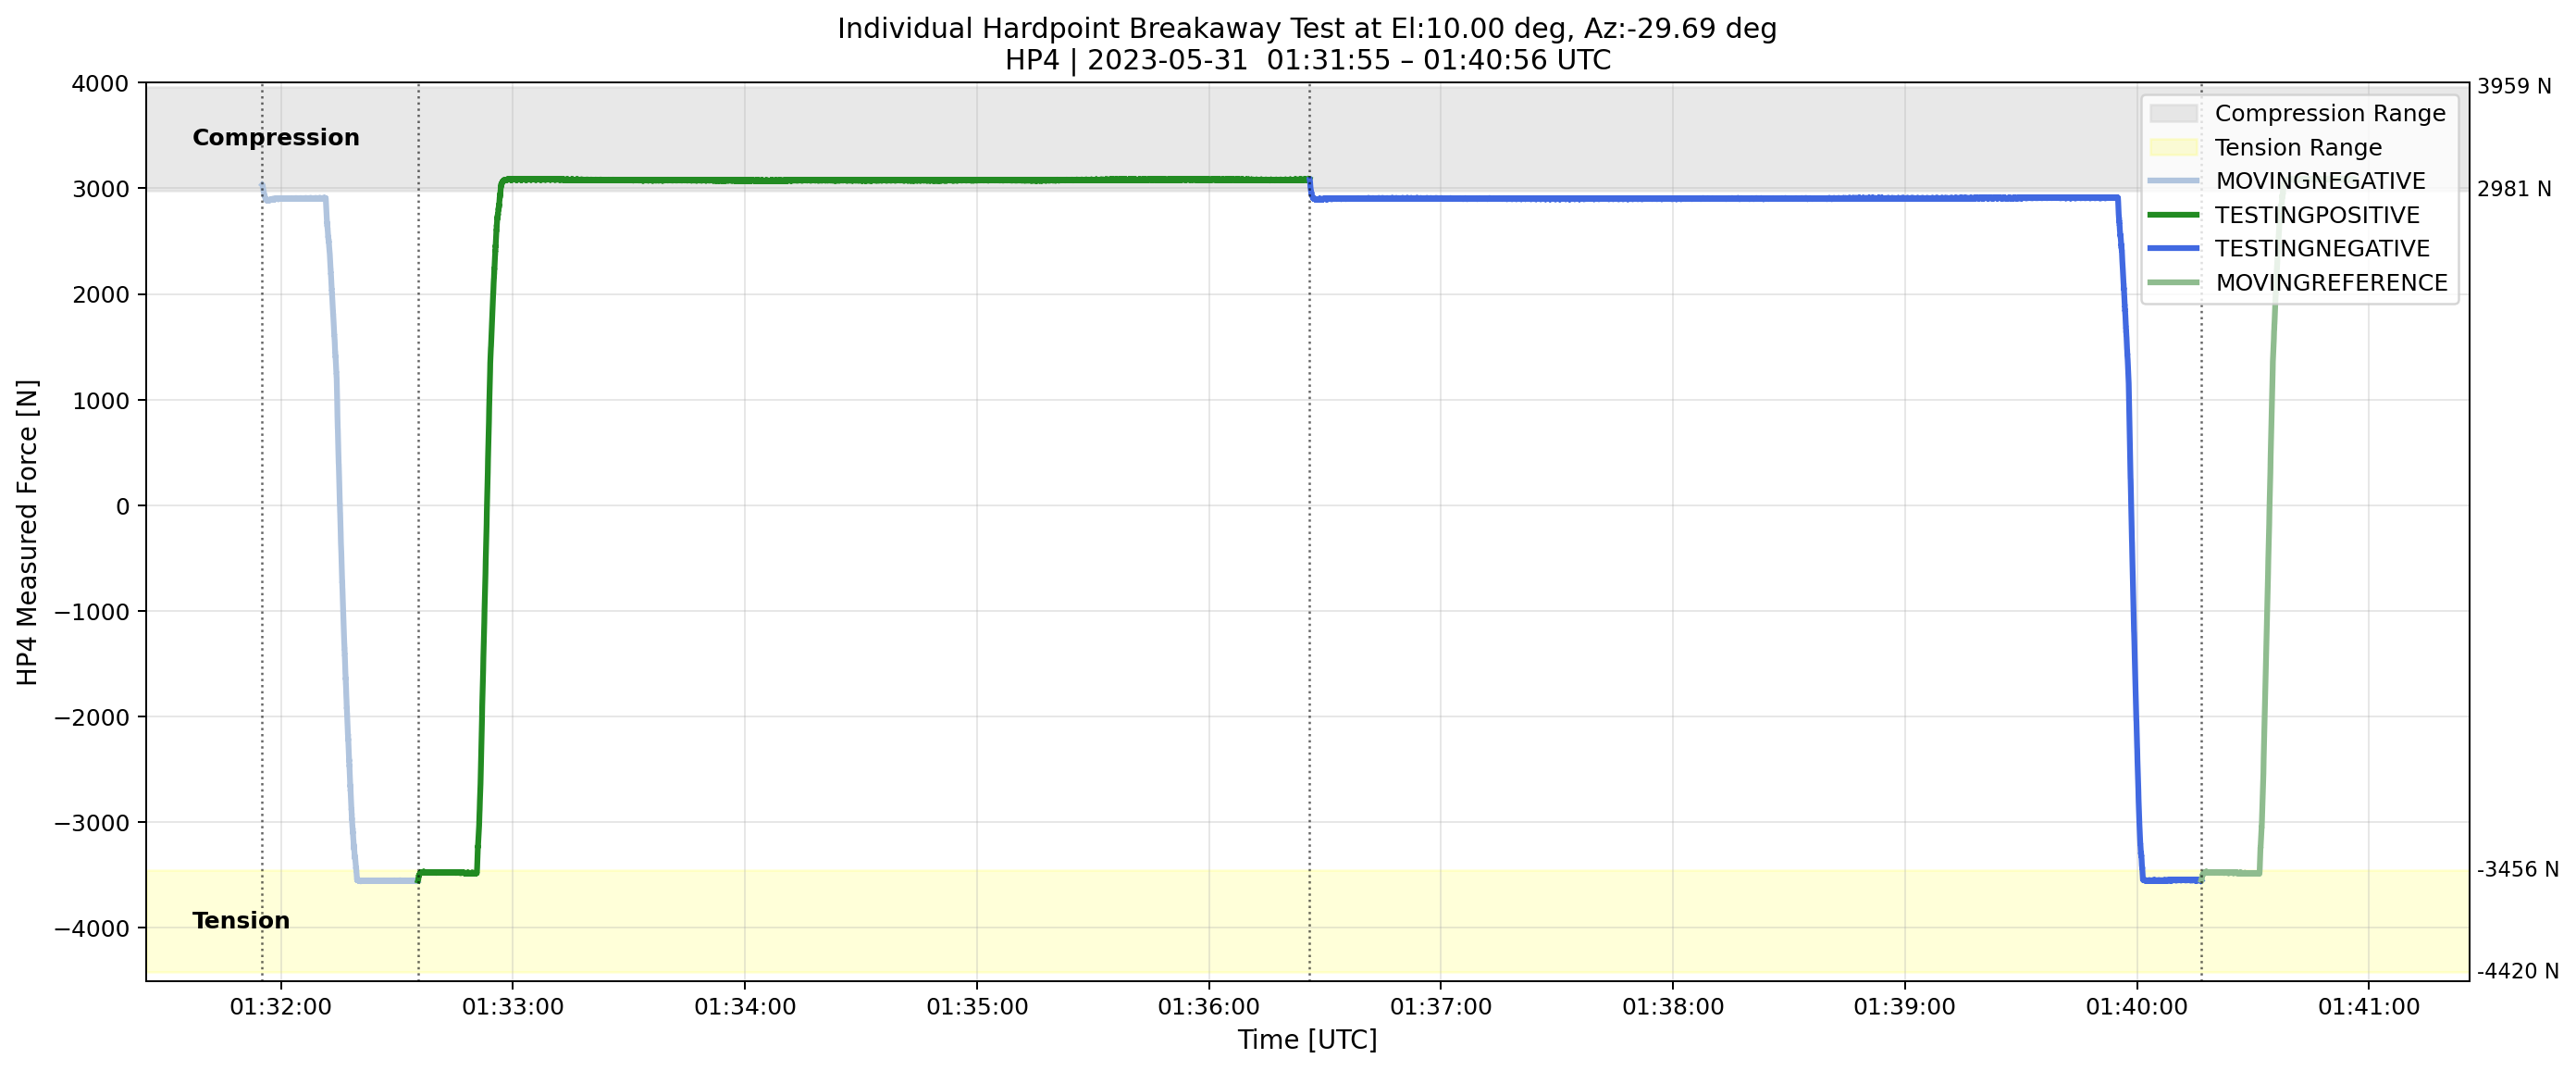
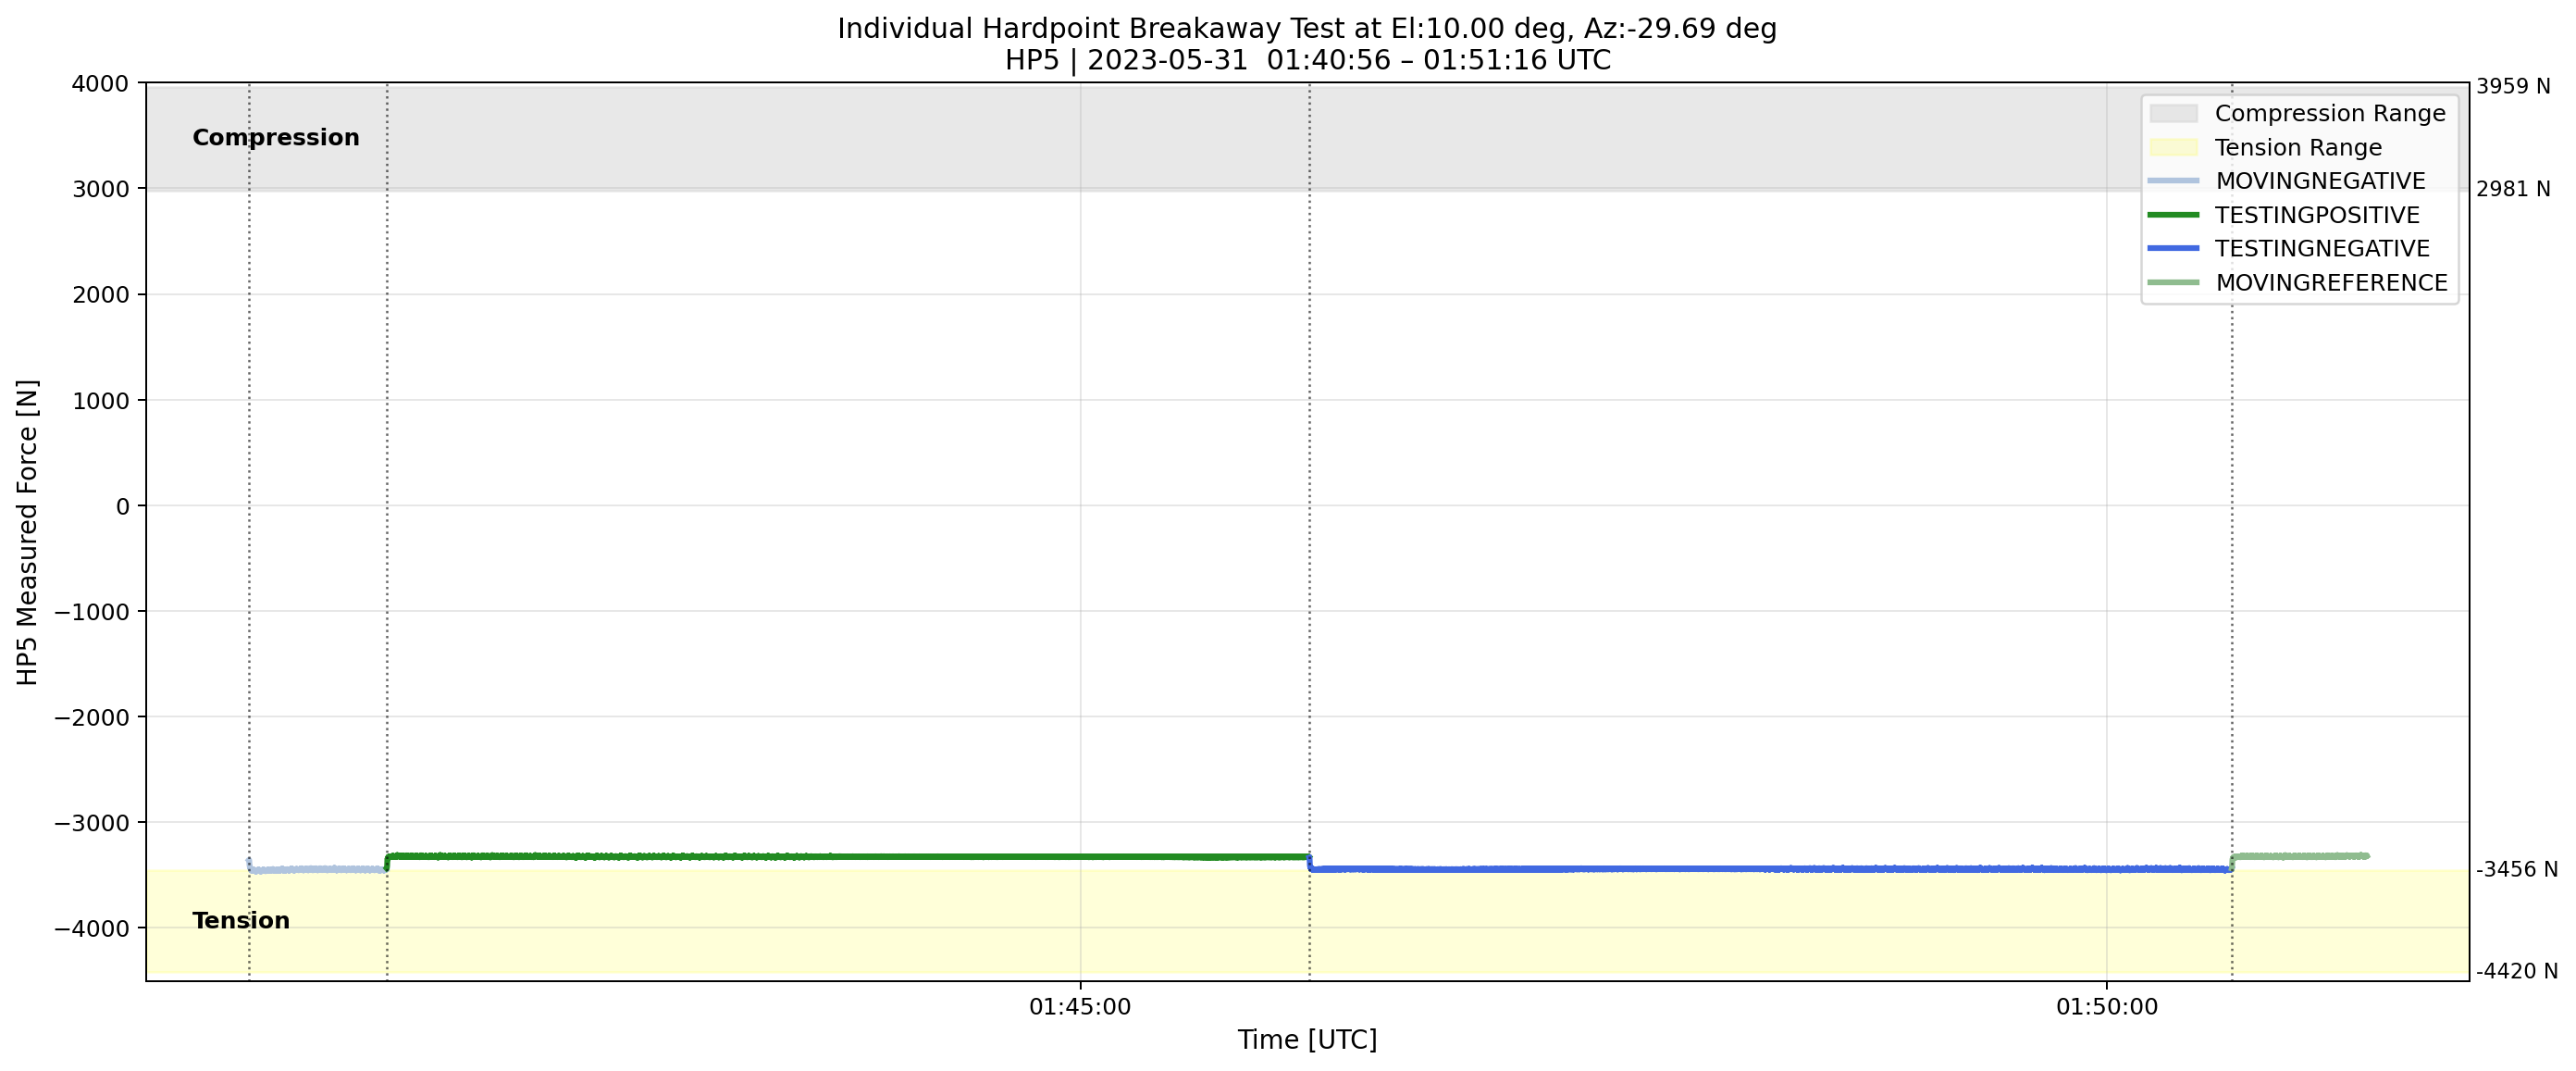
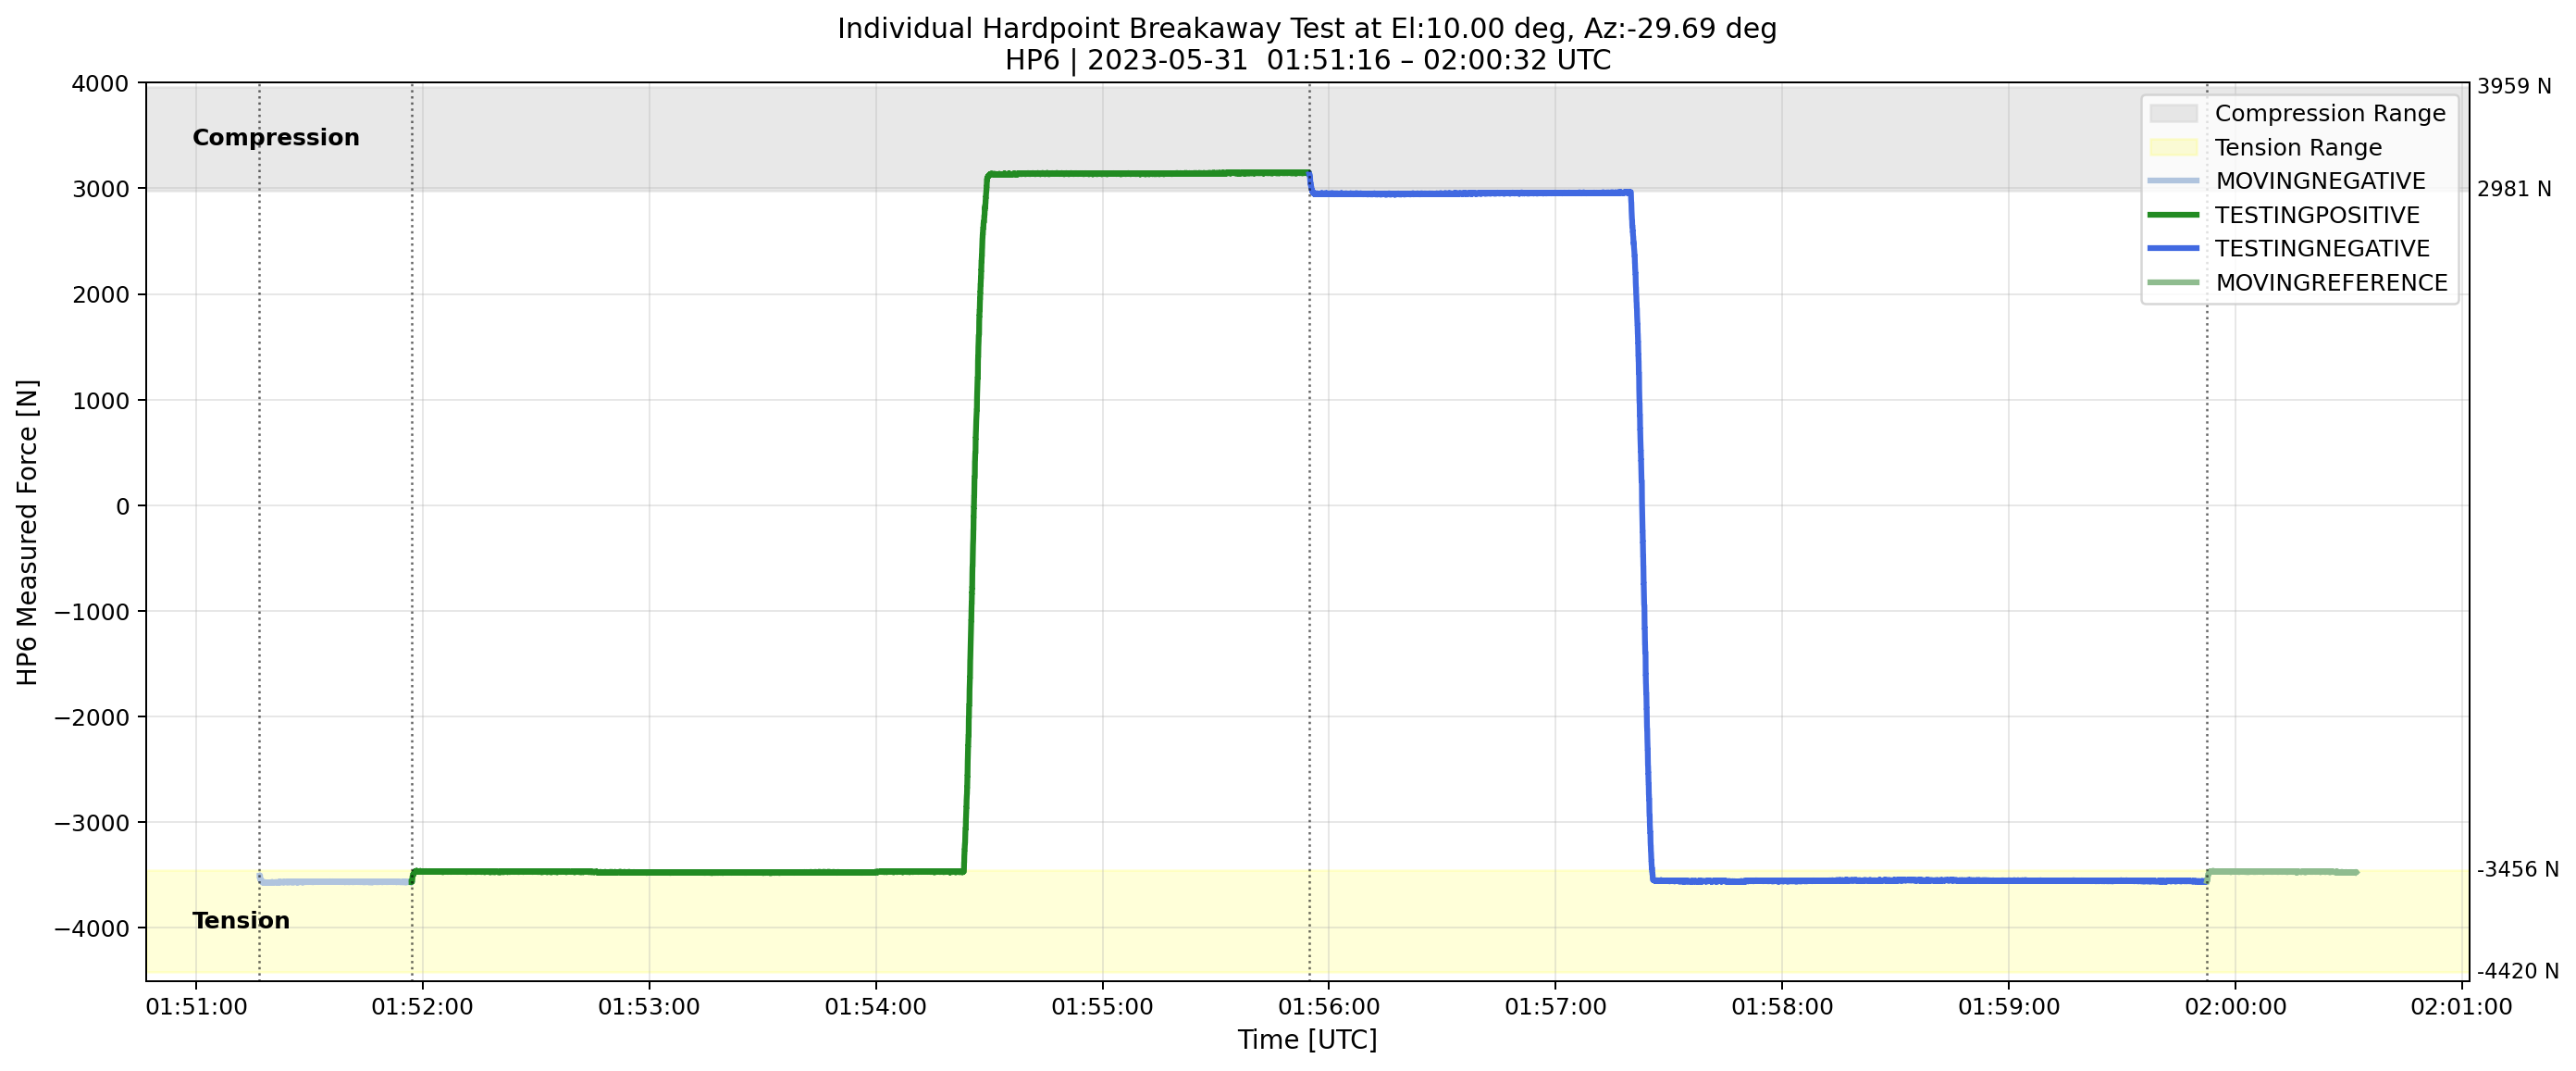
Fig. 13 Transition of the measured forces on each hardpoint when the TMA is at el=10deg.#
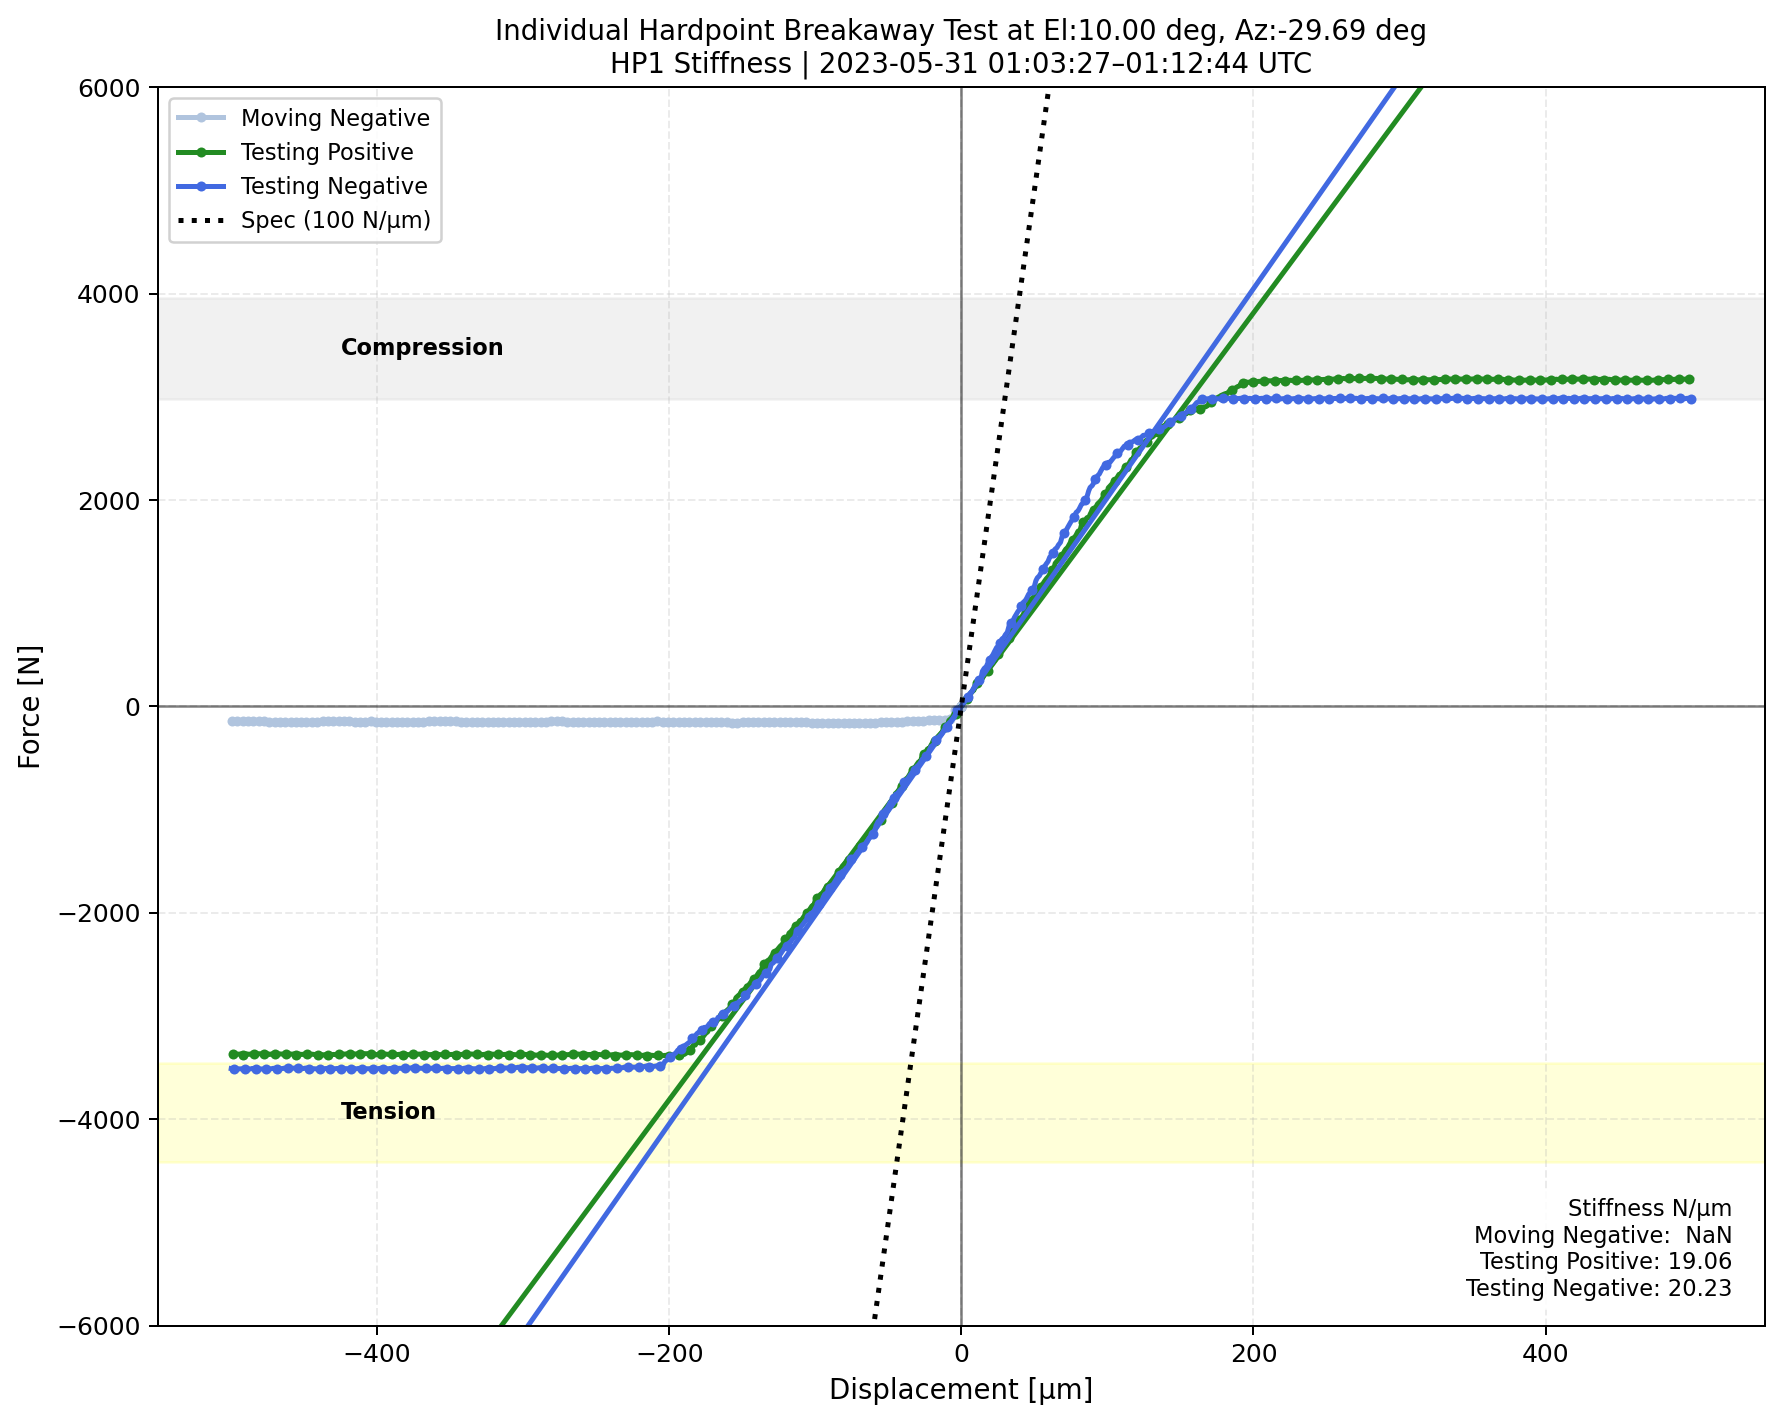
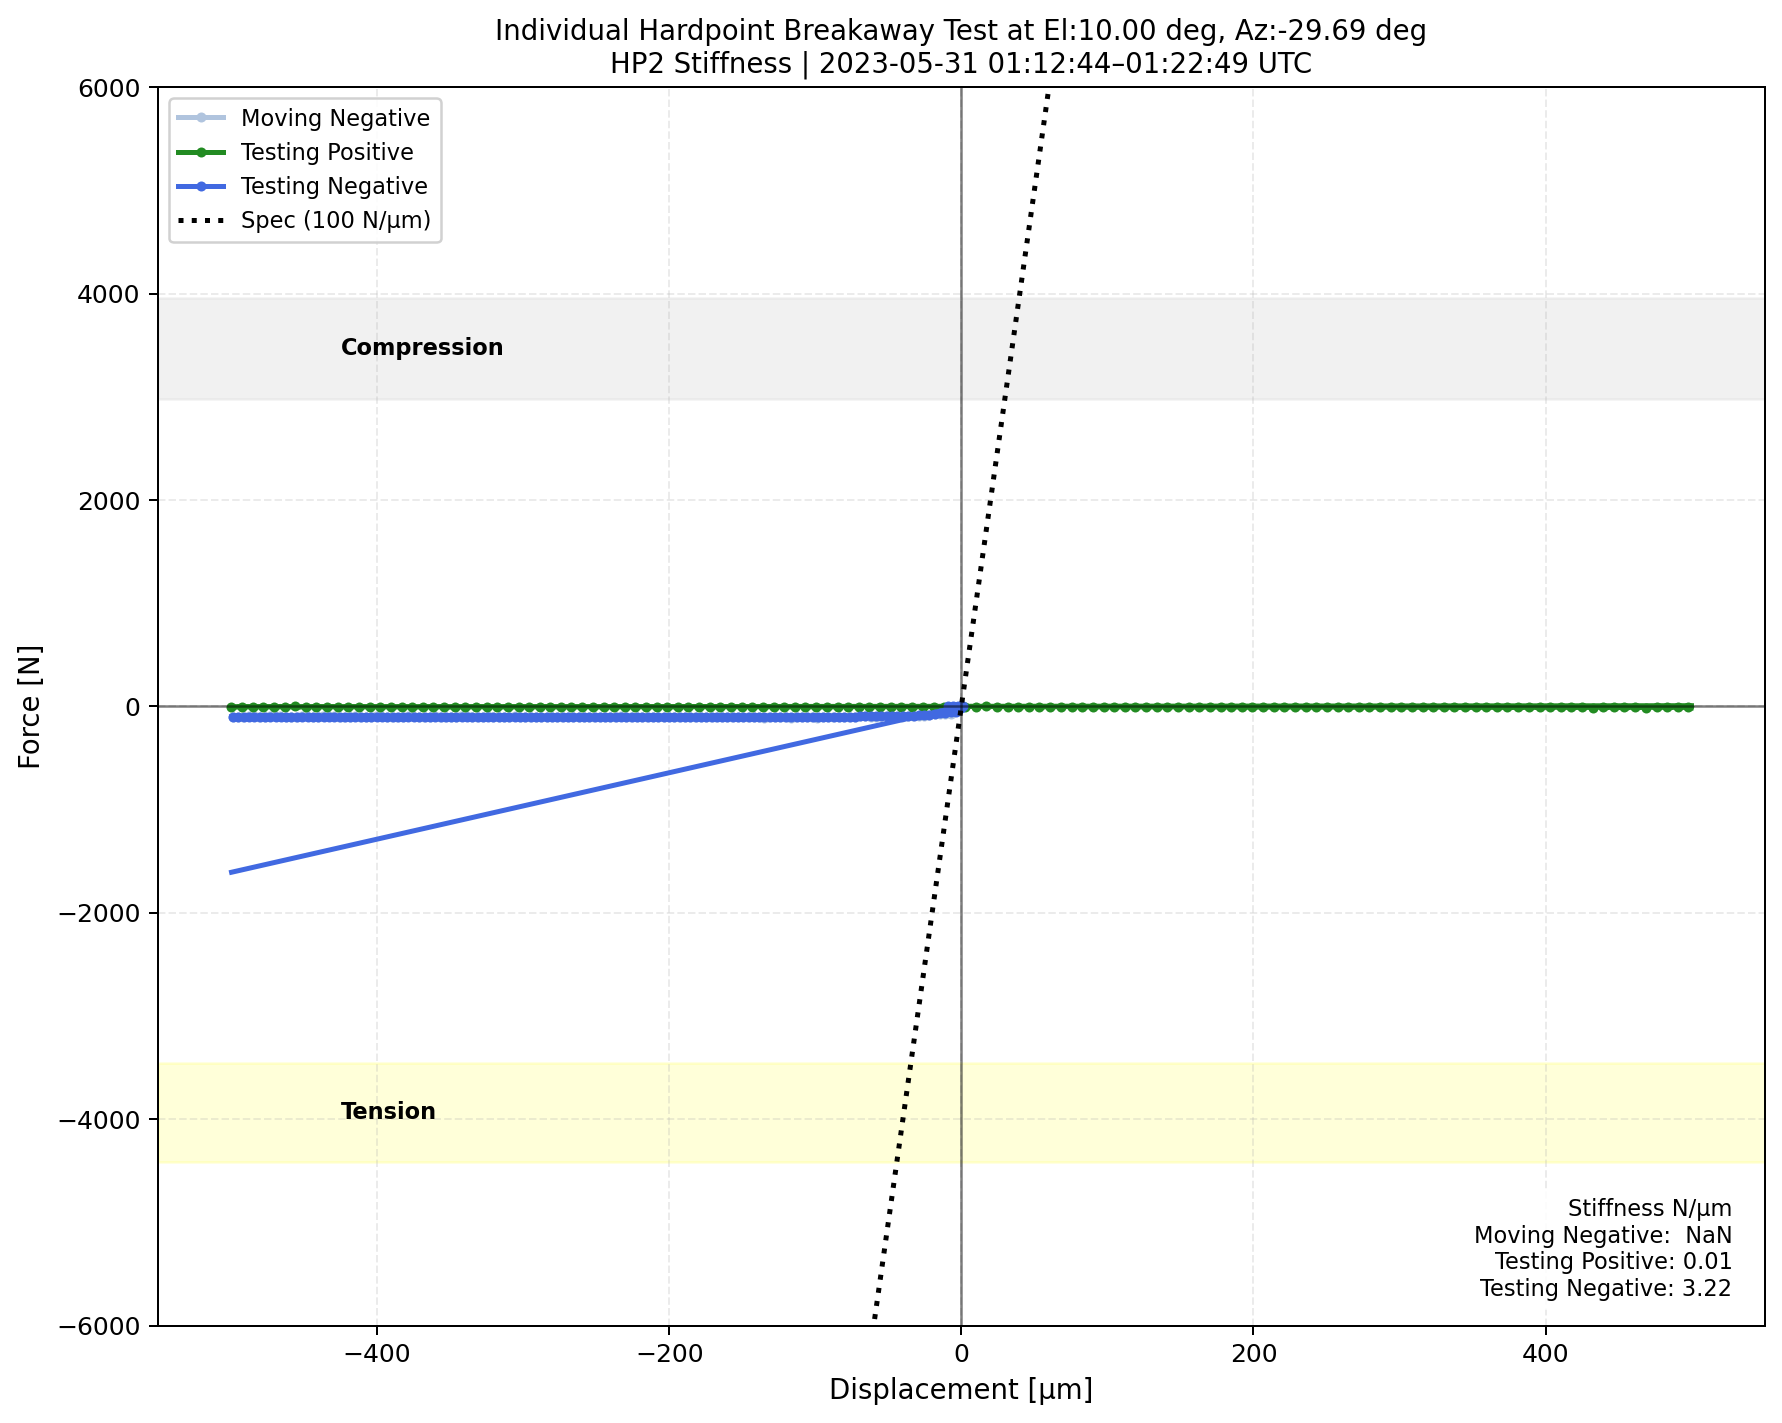

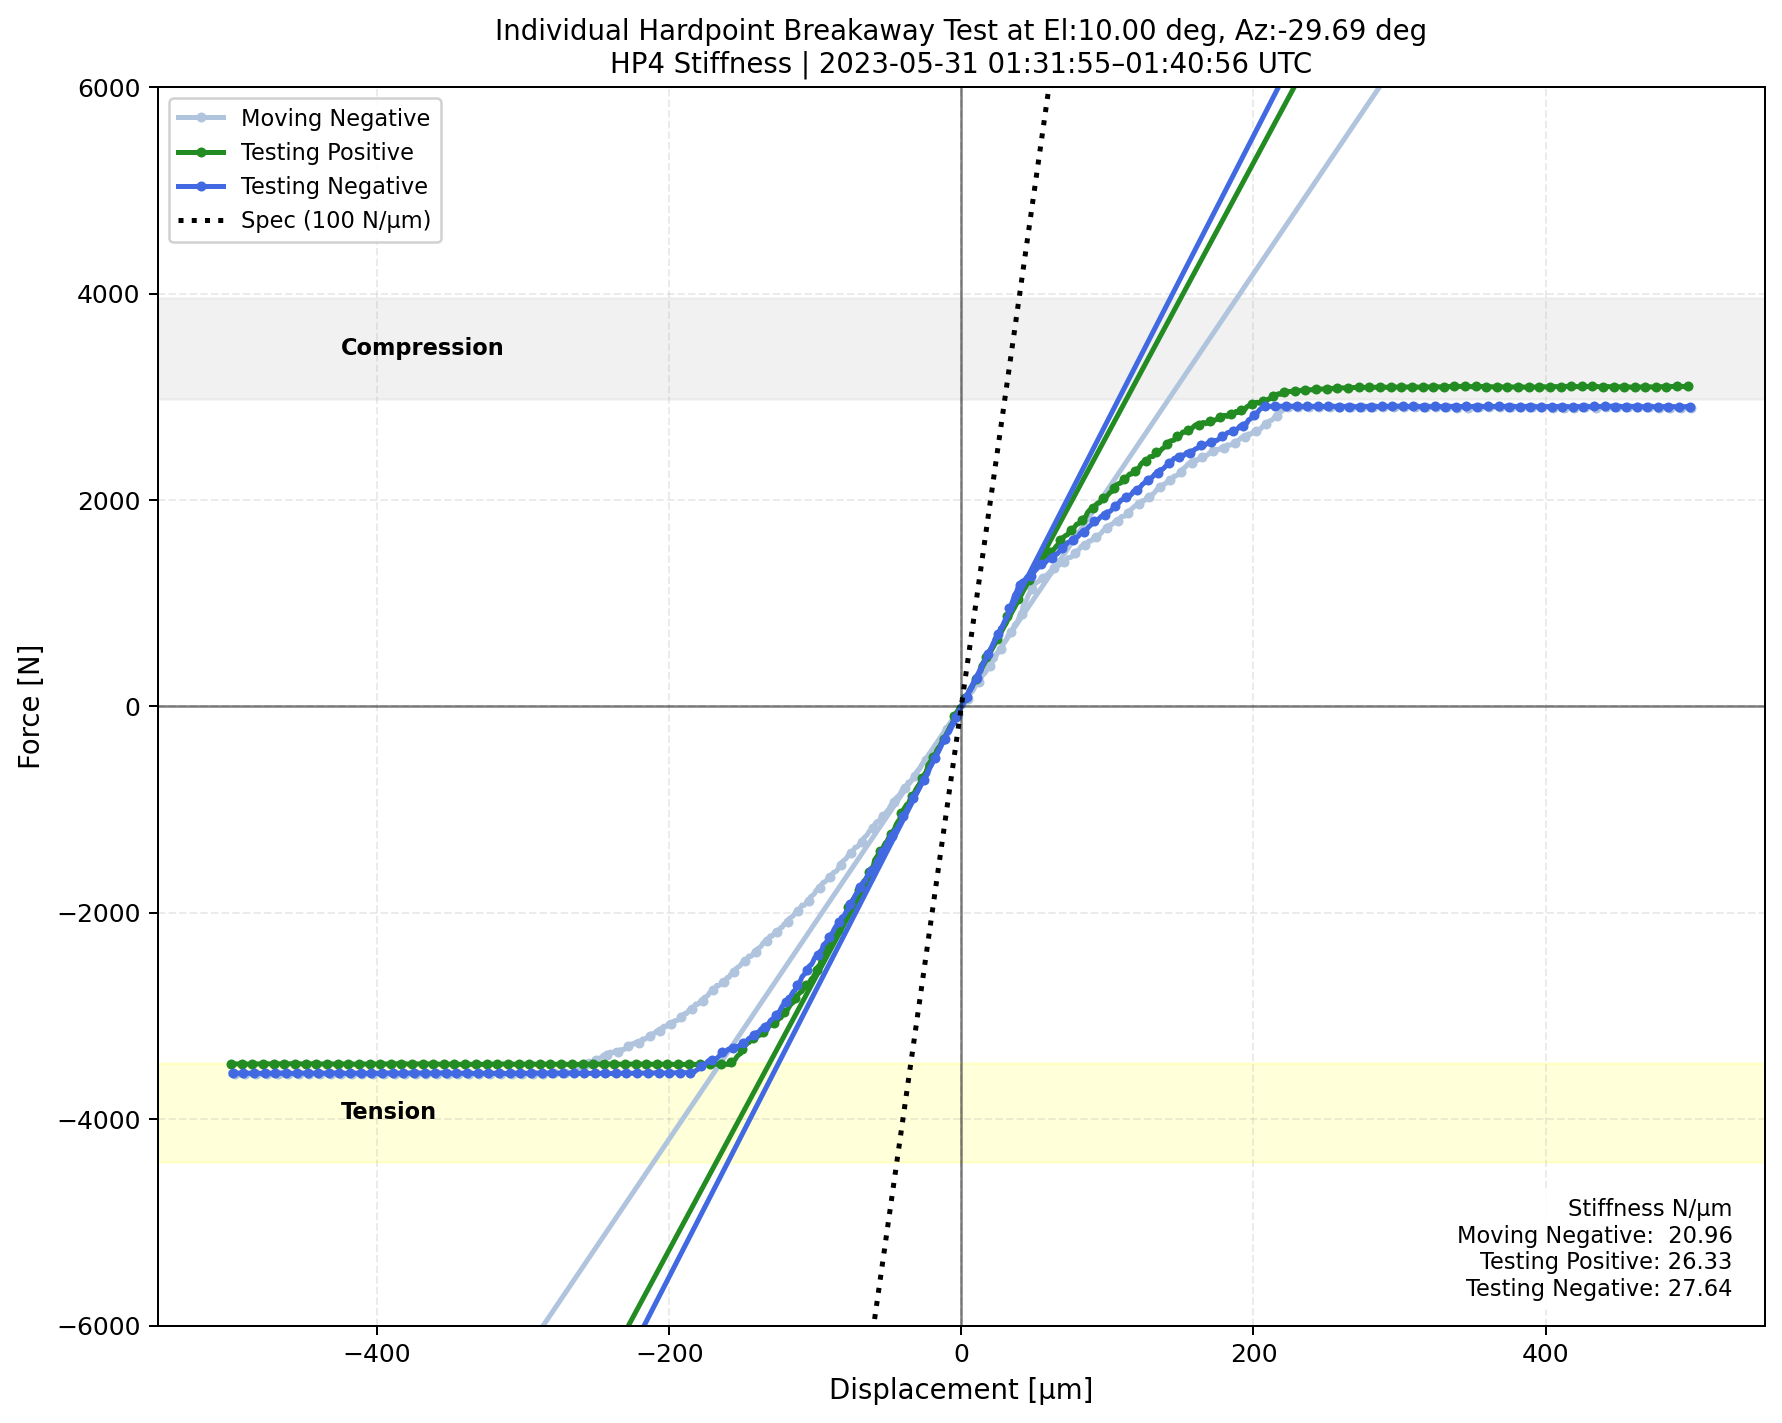
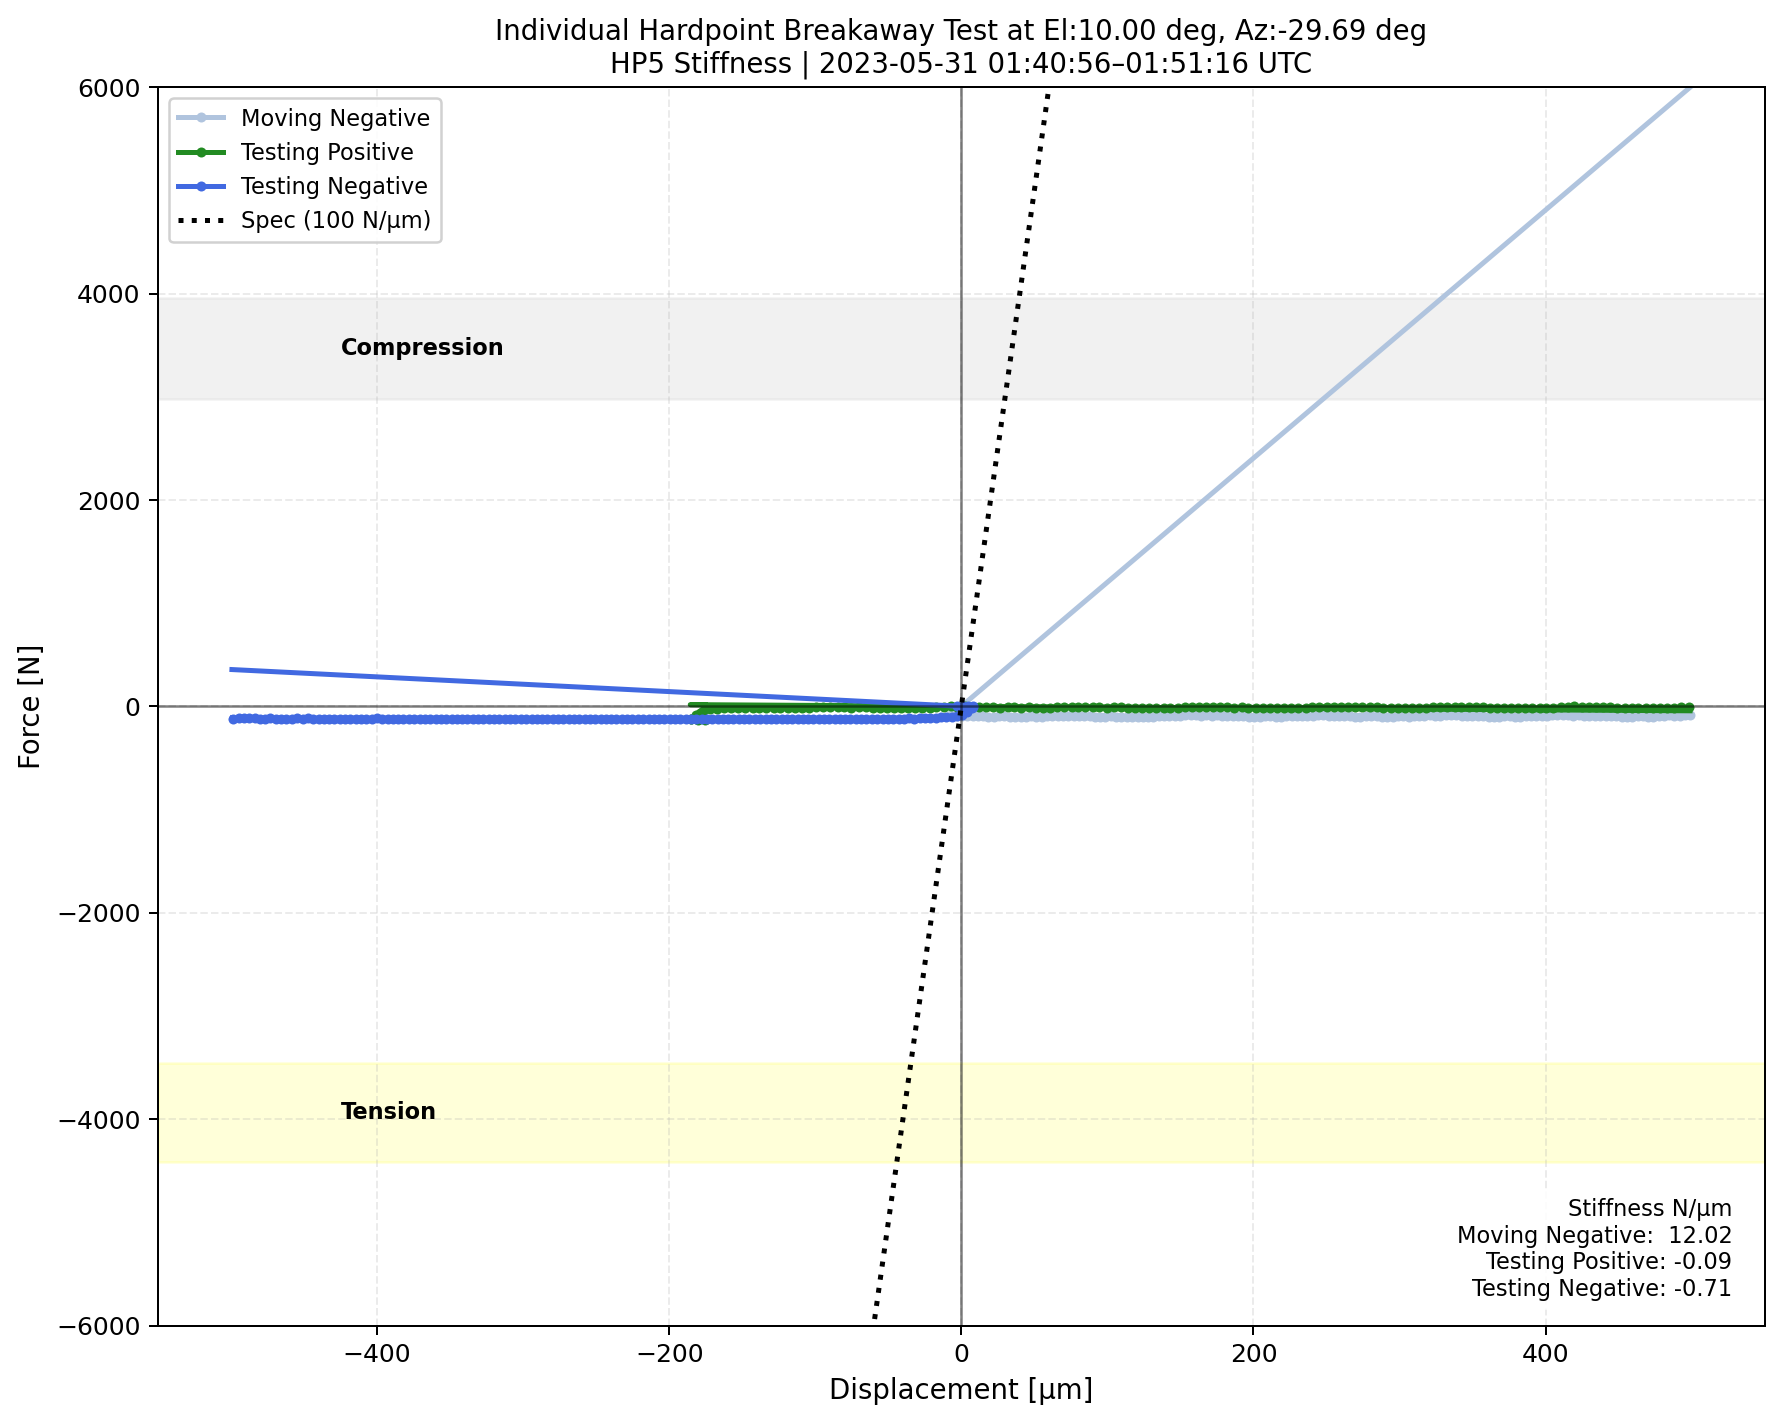
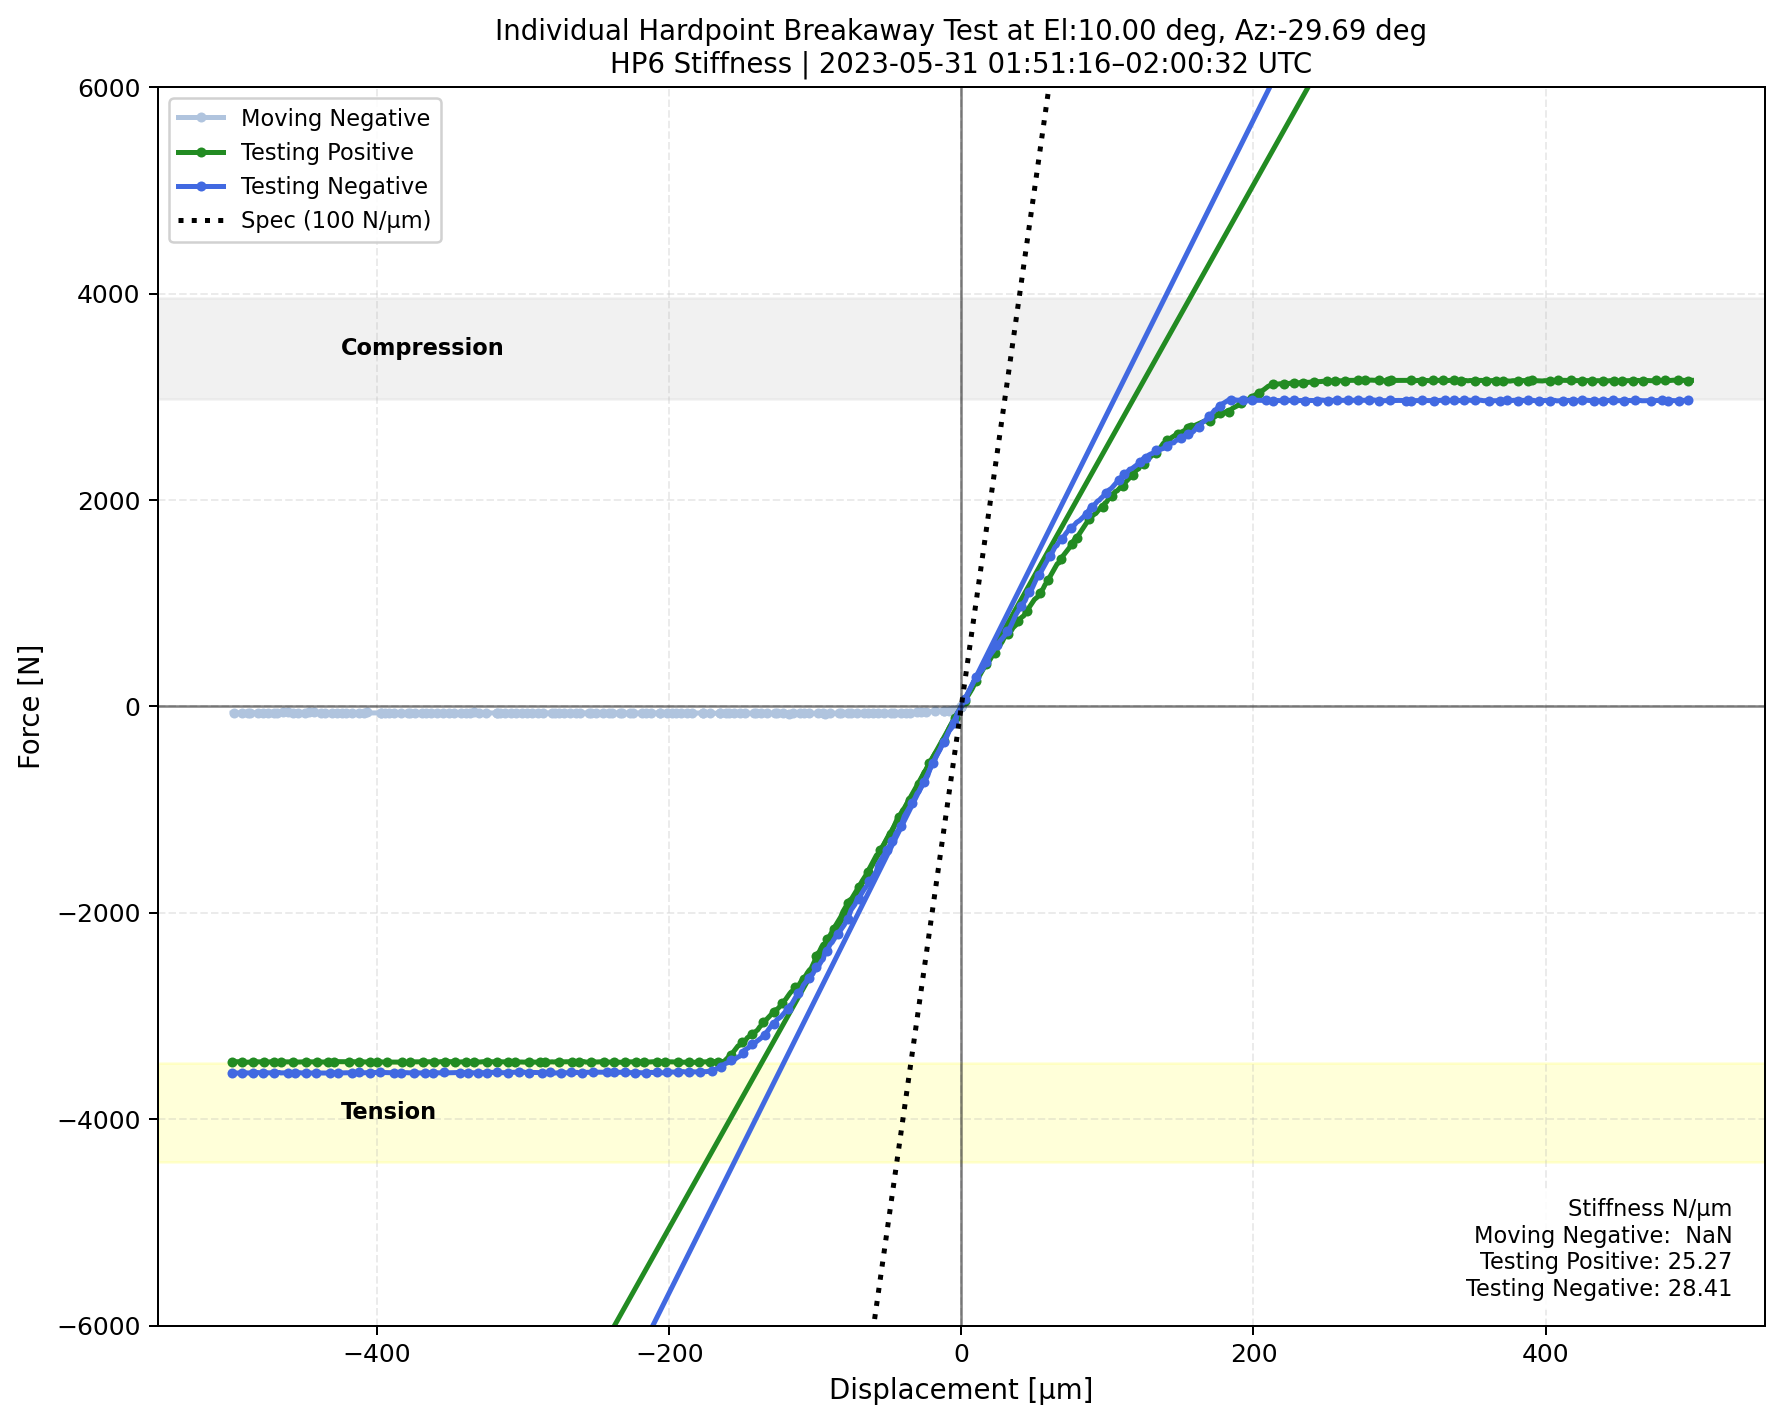
Fig. 14 <math>\Delta</math>Displacement versus measured forces for each phase during the hardpoint breakaway test when the TMA is at el=10 deg.#
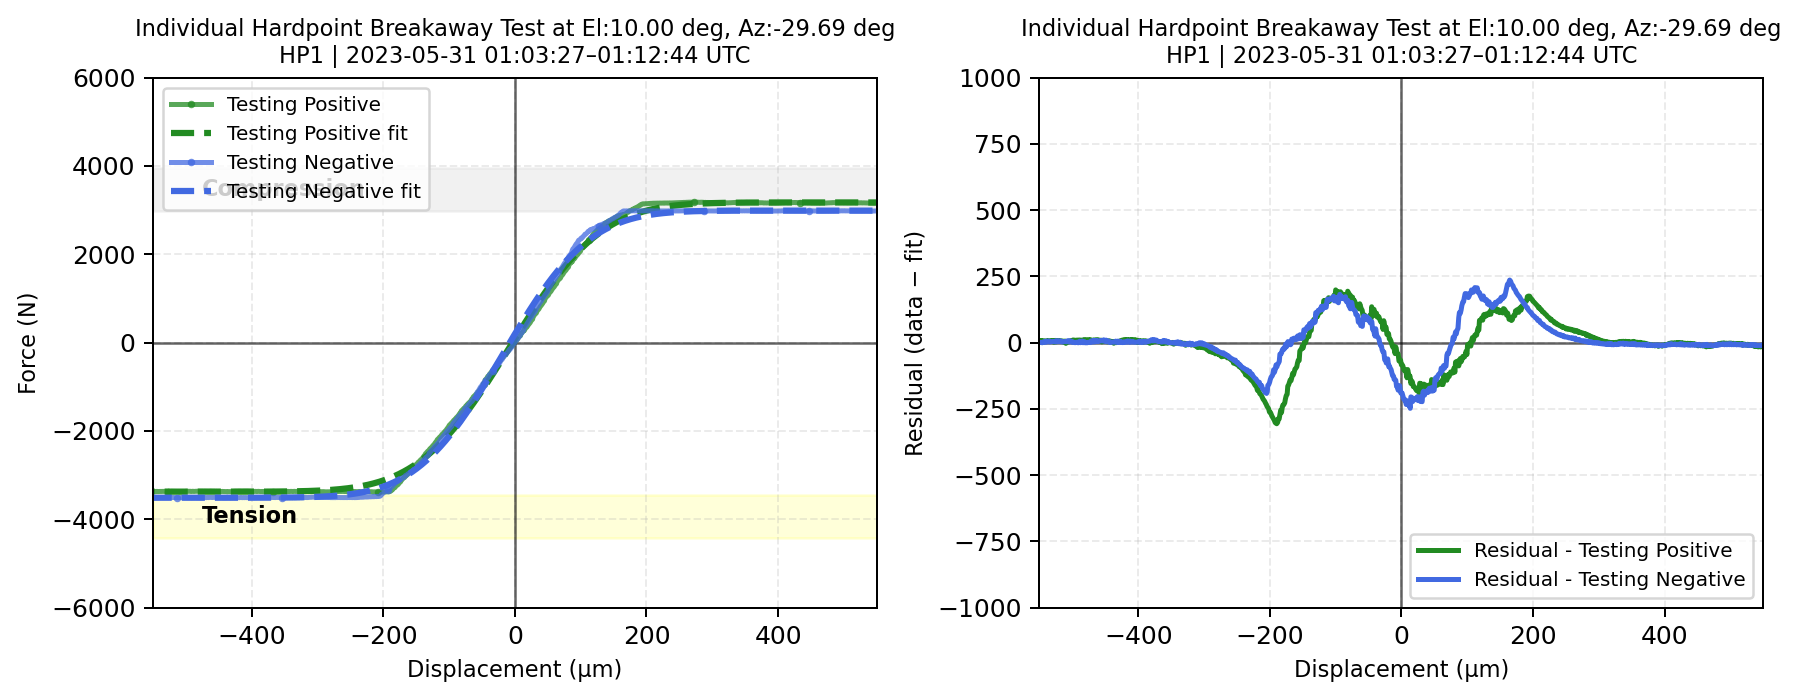
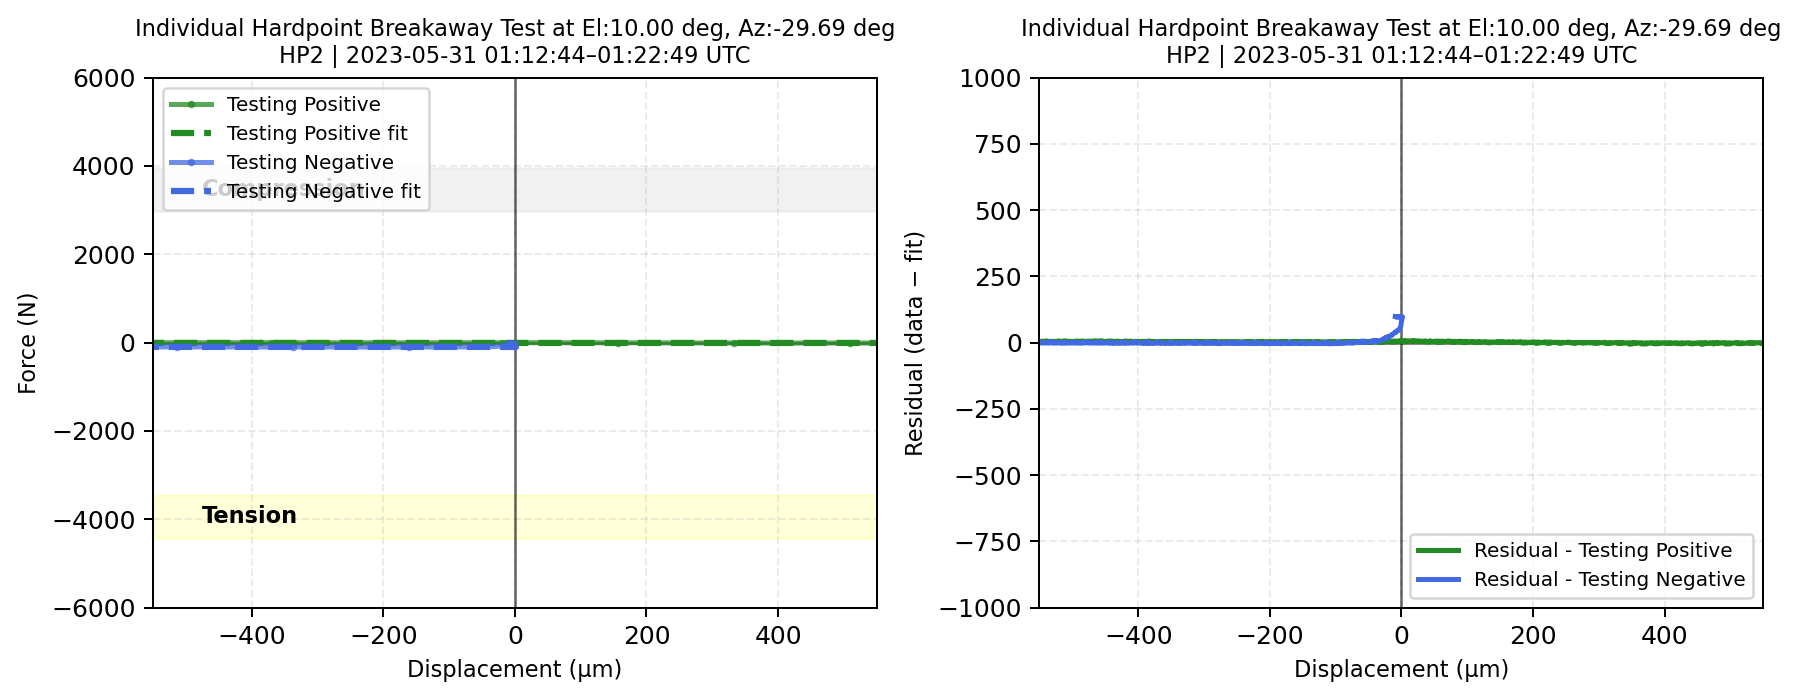


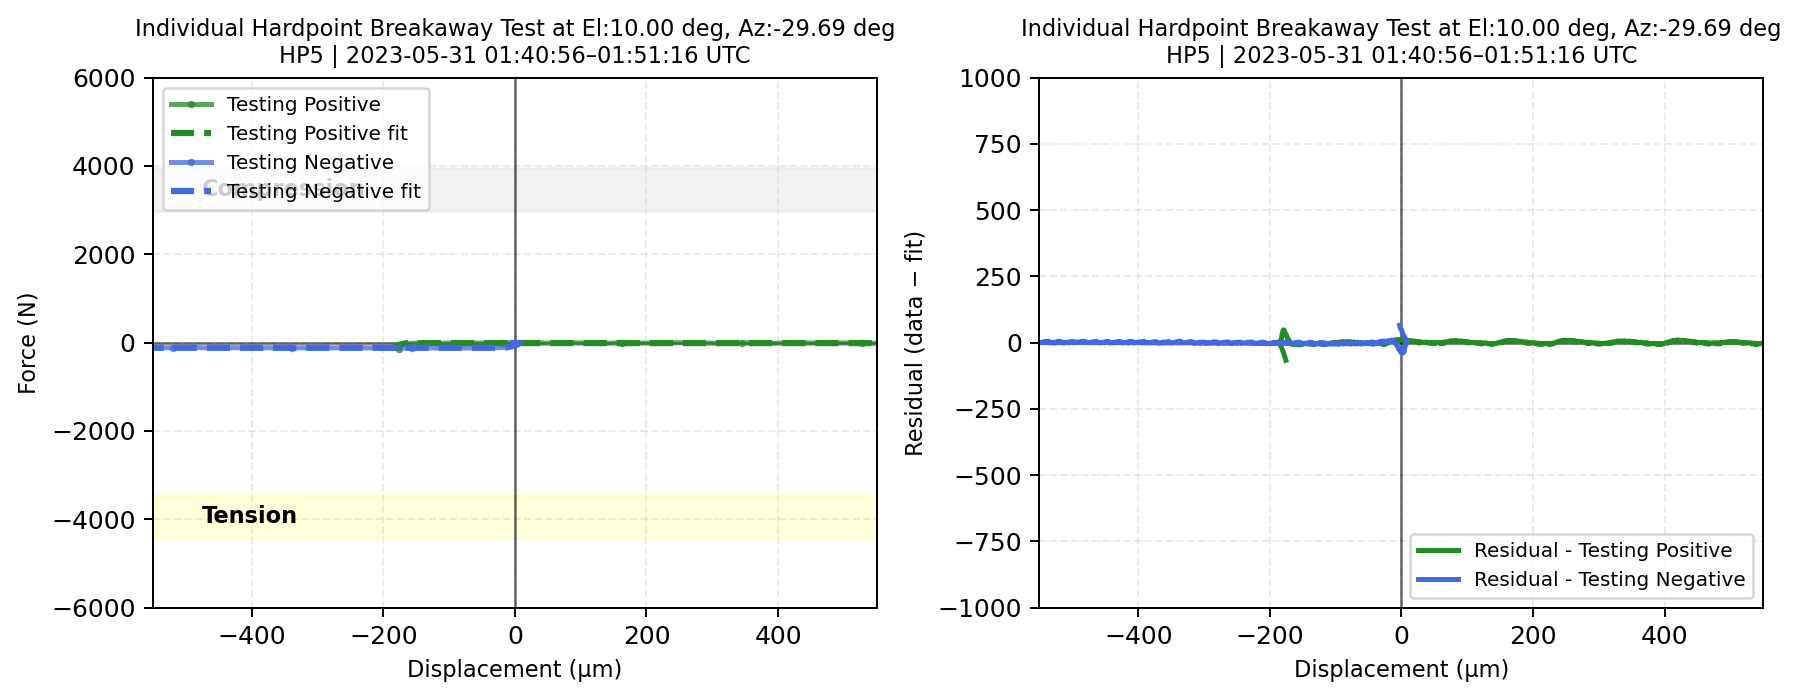
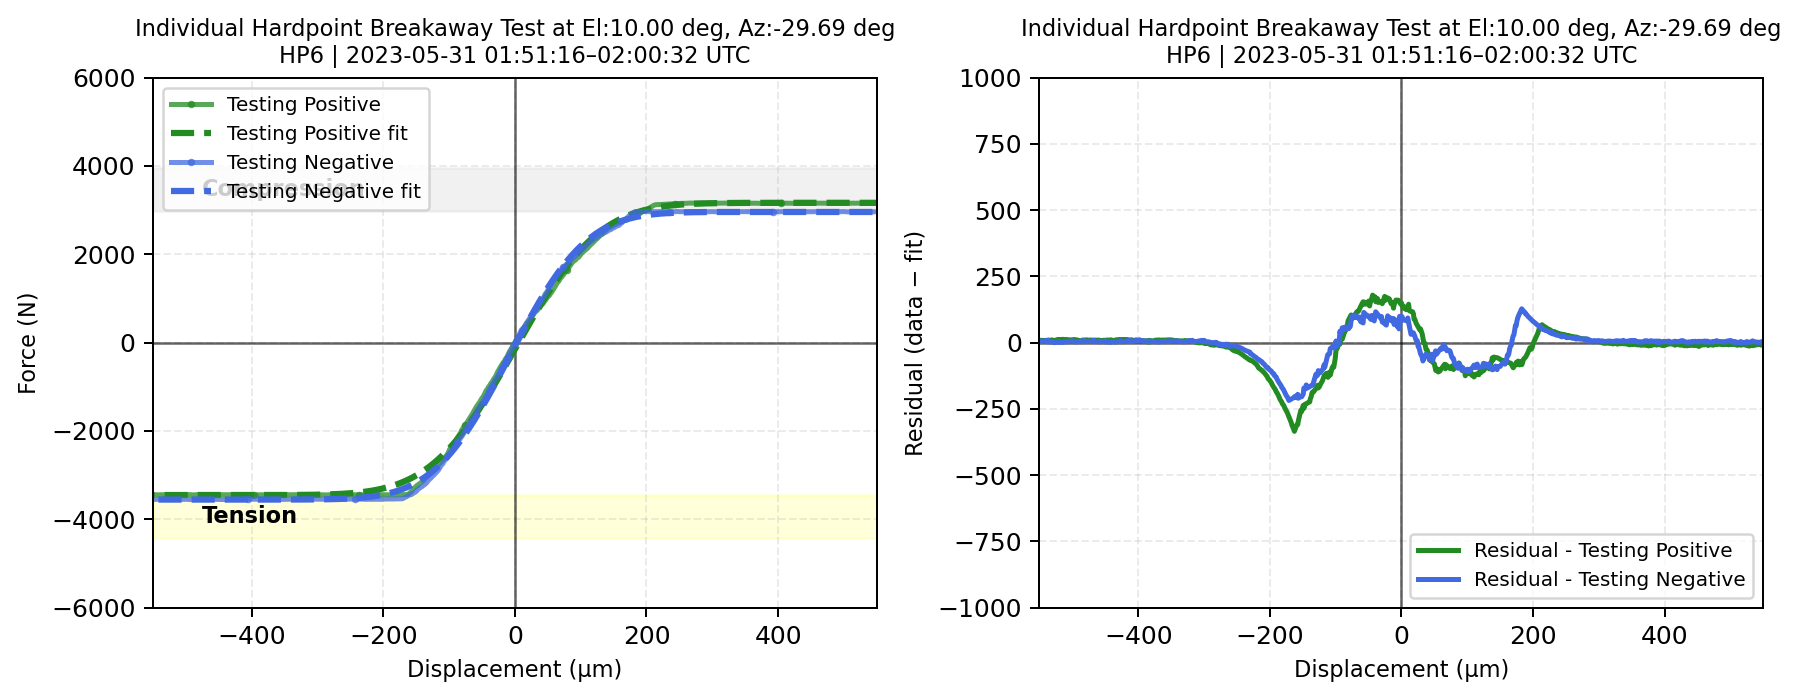
Fig. 15 (Left) \(\Delta\)Displacement versus measured forces for each phase during the hardpoint breakaway test fit with error function (the TMA at el=10deg). (Right) The residual, a difference between data and error function, with respect to \(\Delta\)displacement#
HP Test at el 5 deg#
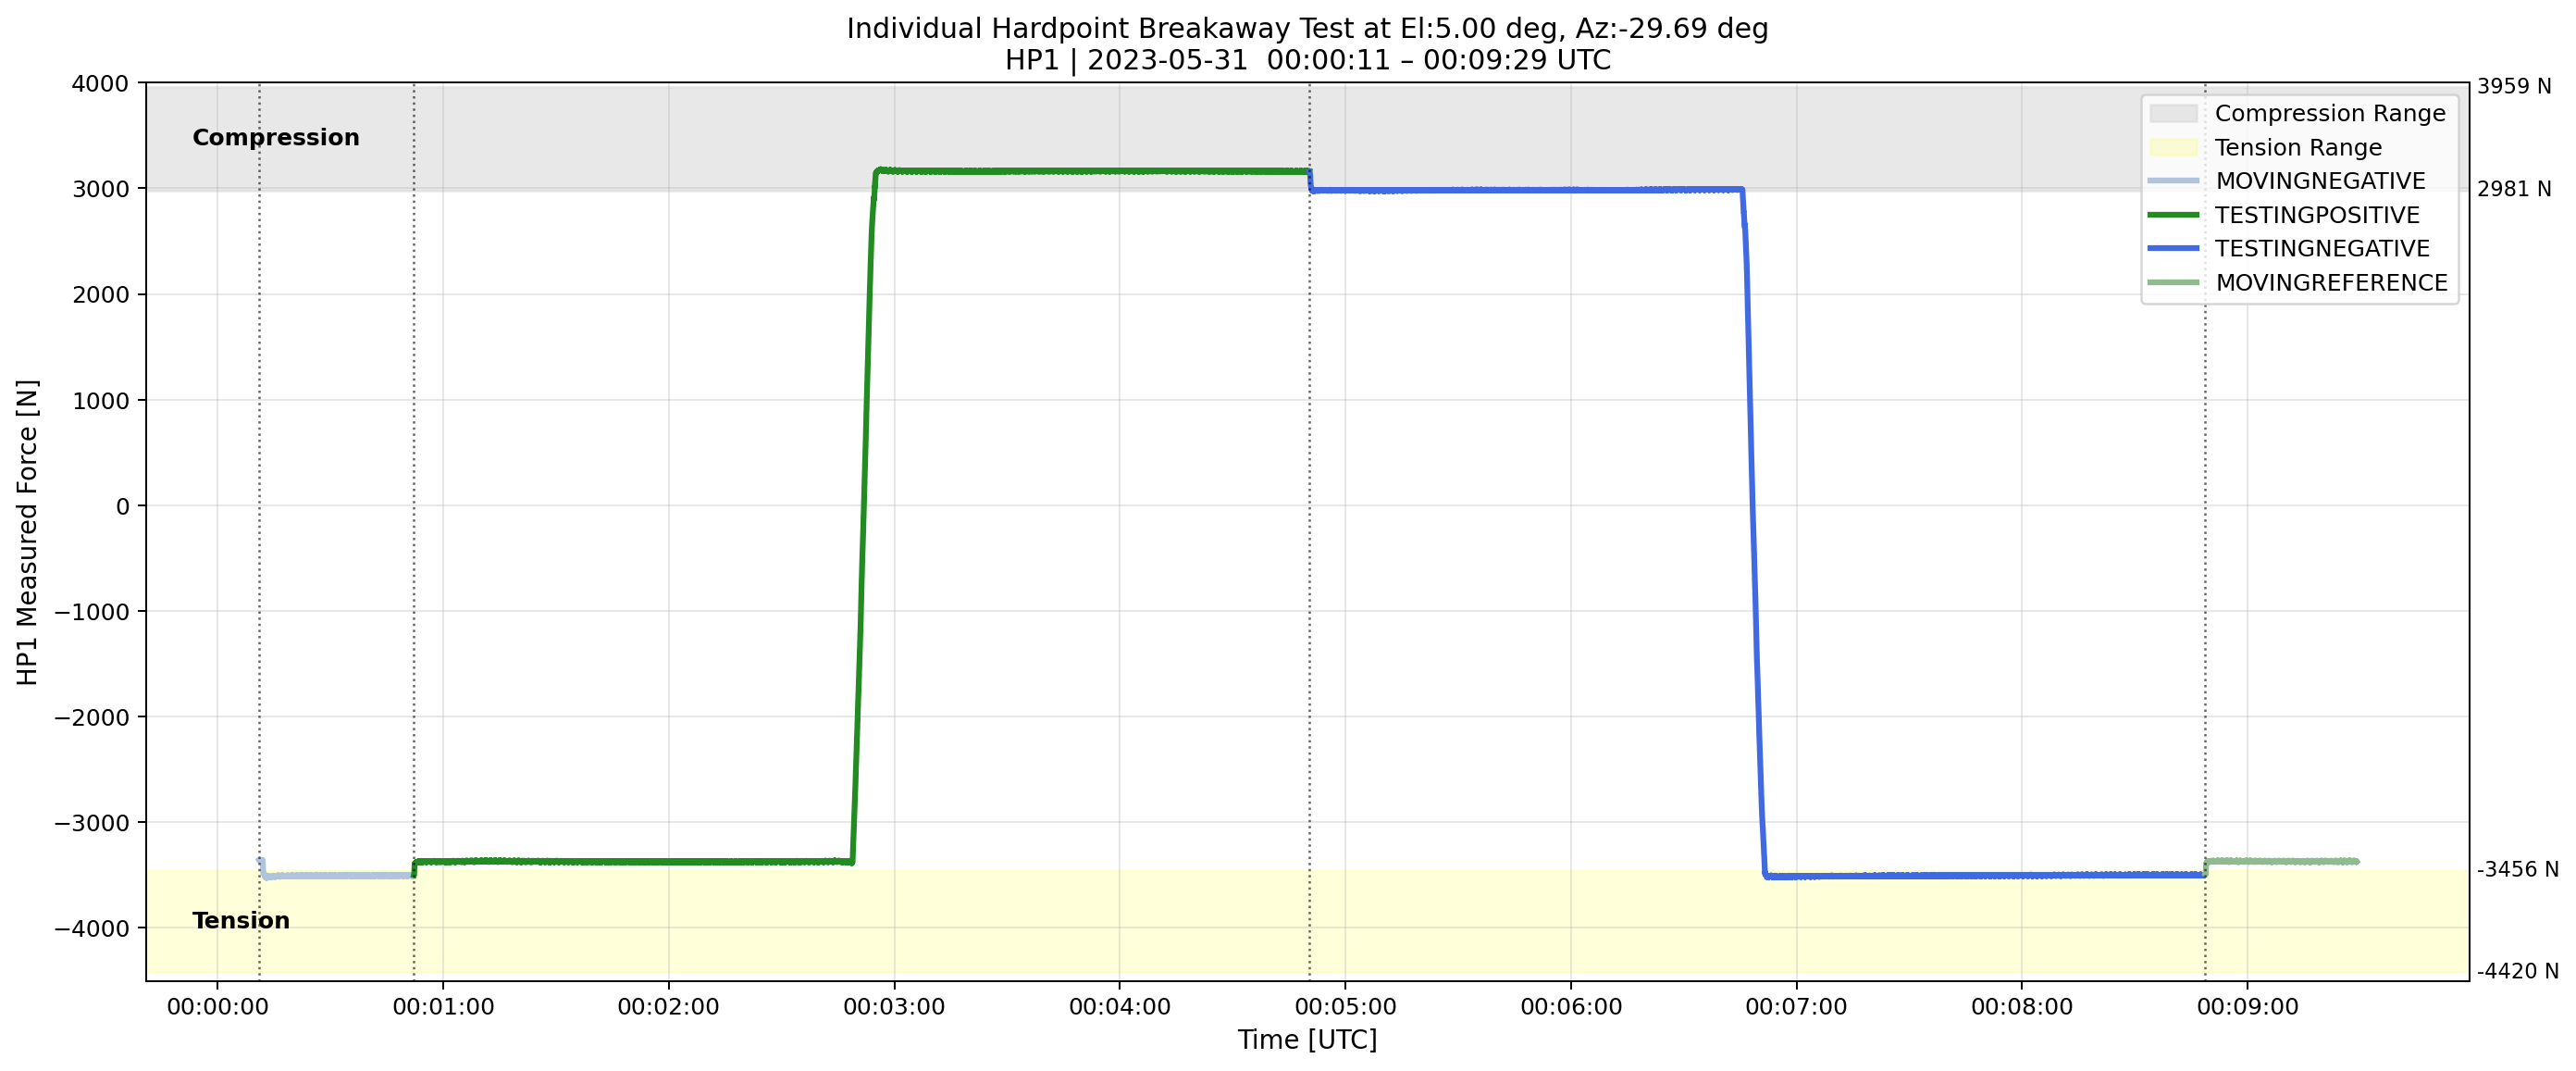
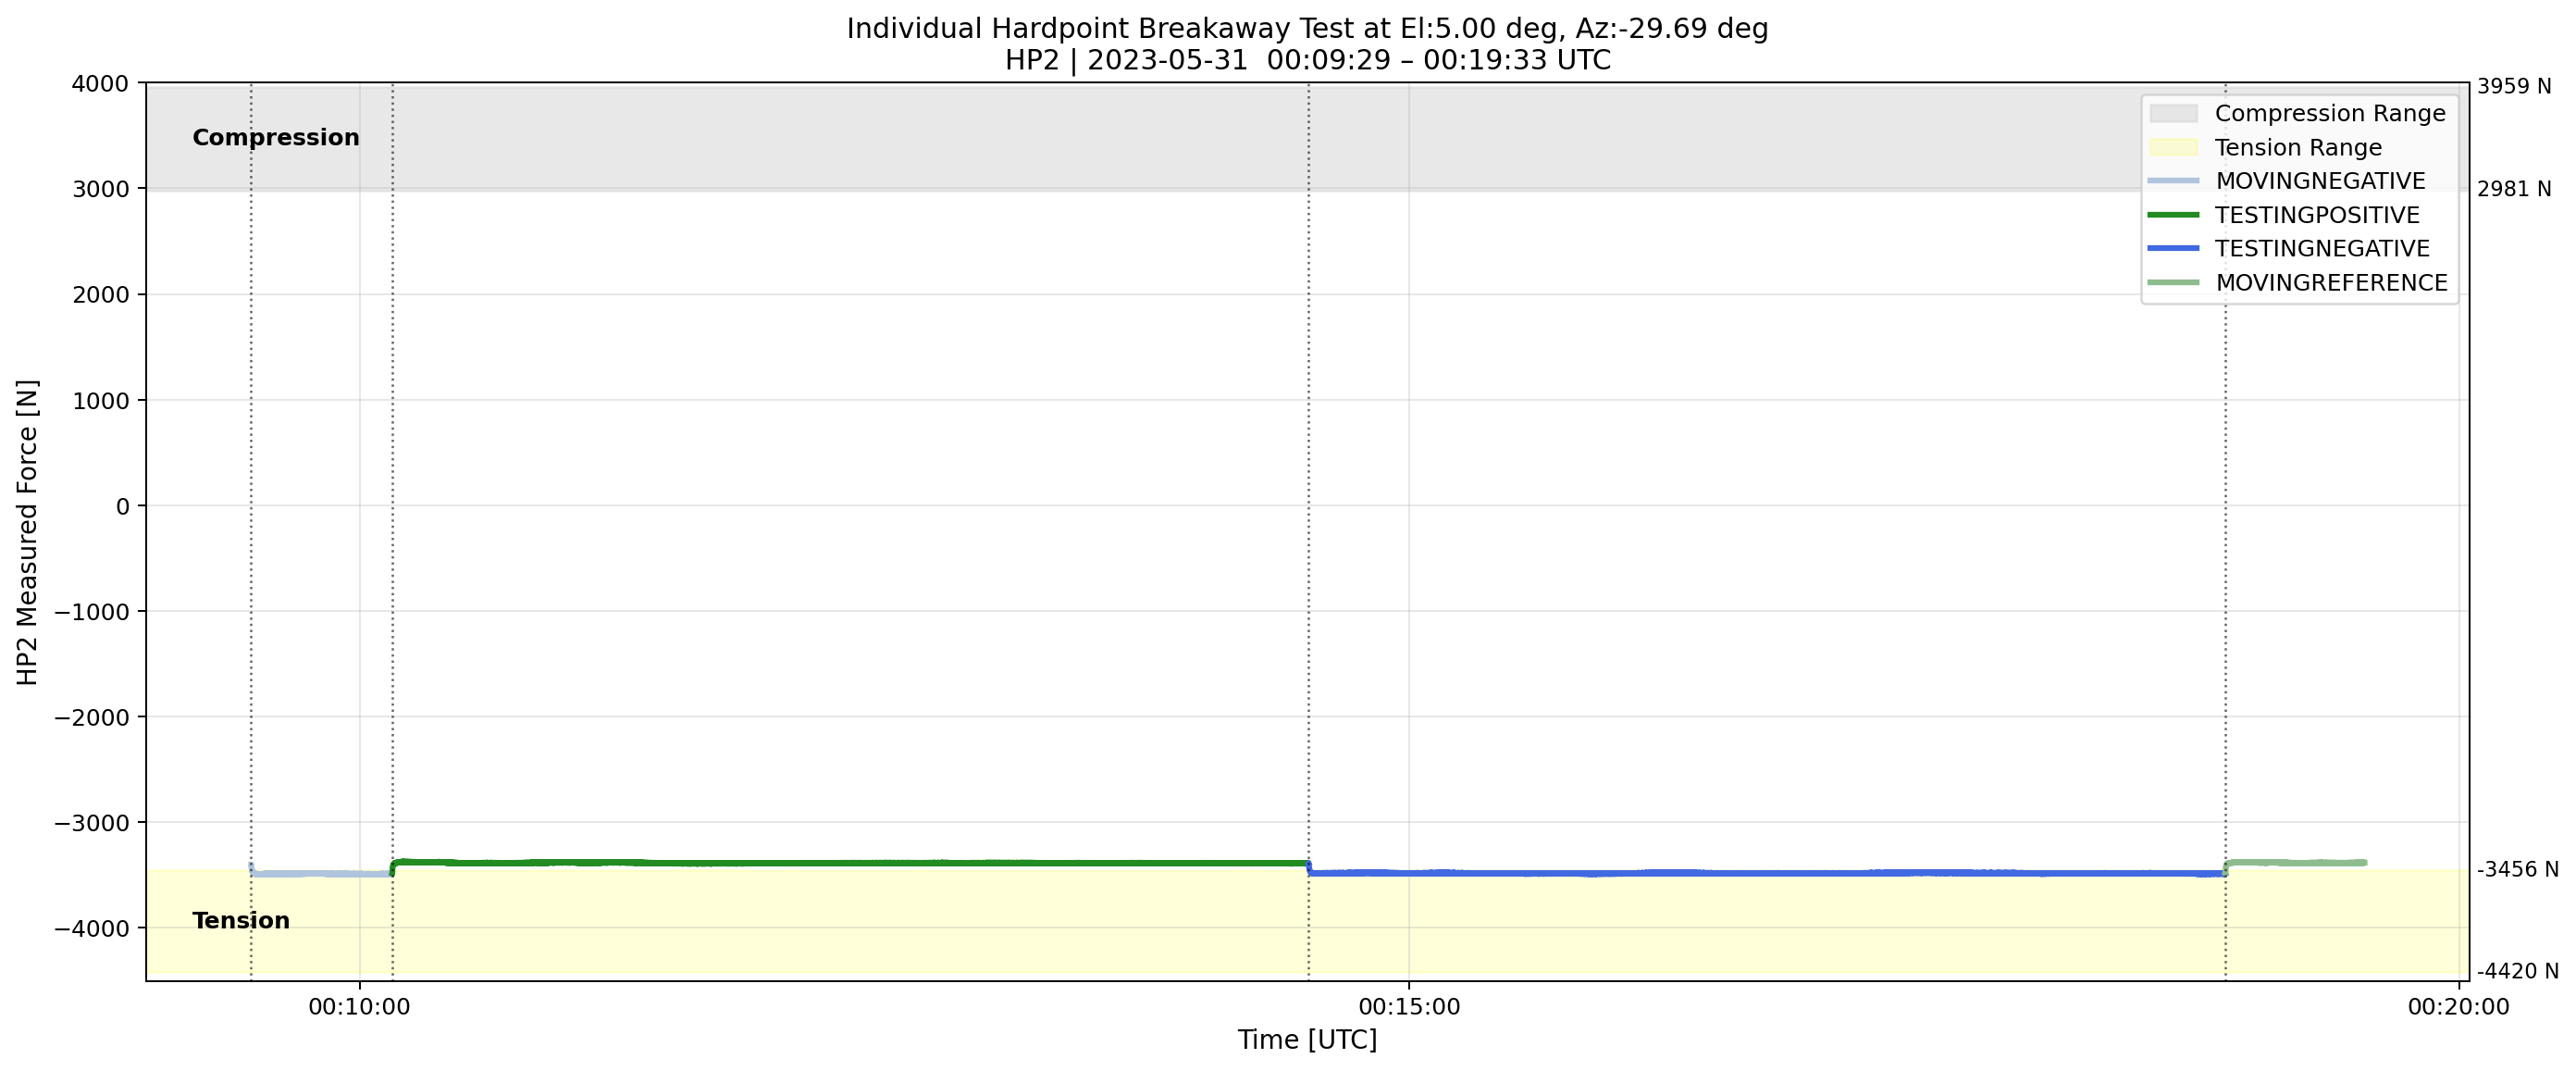
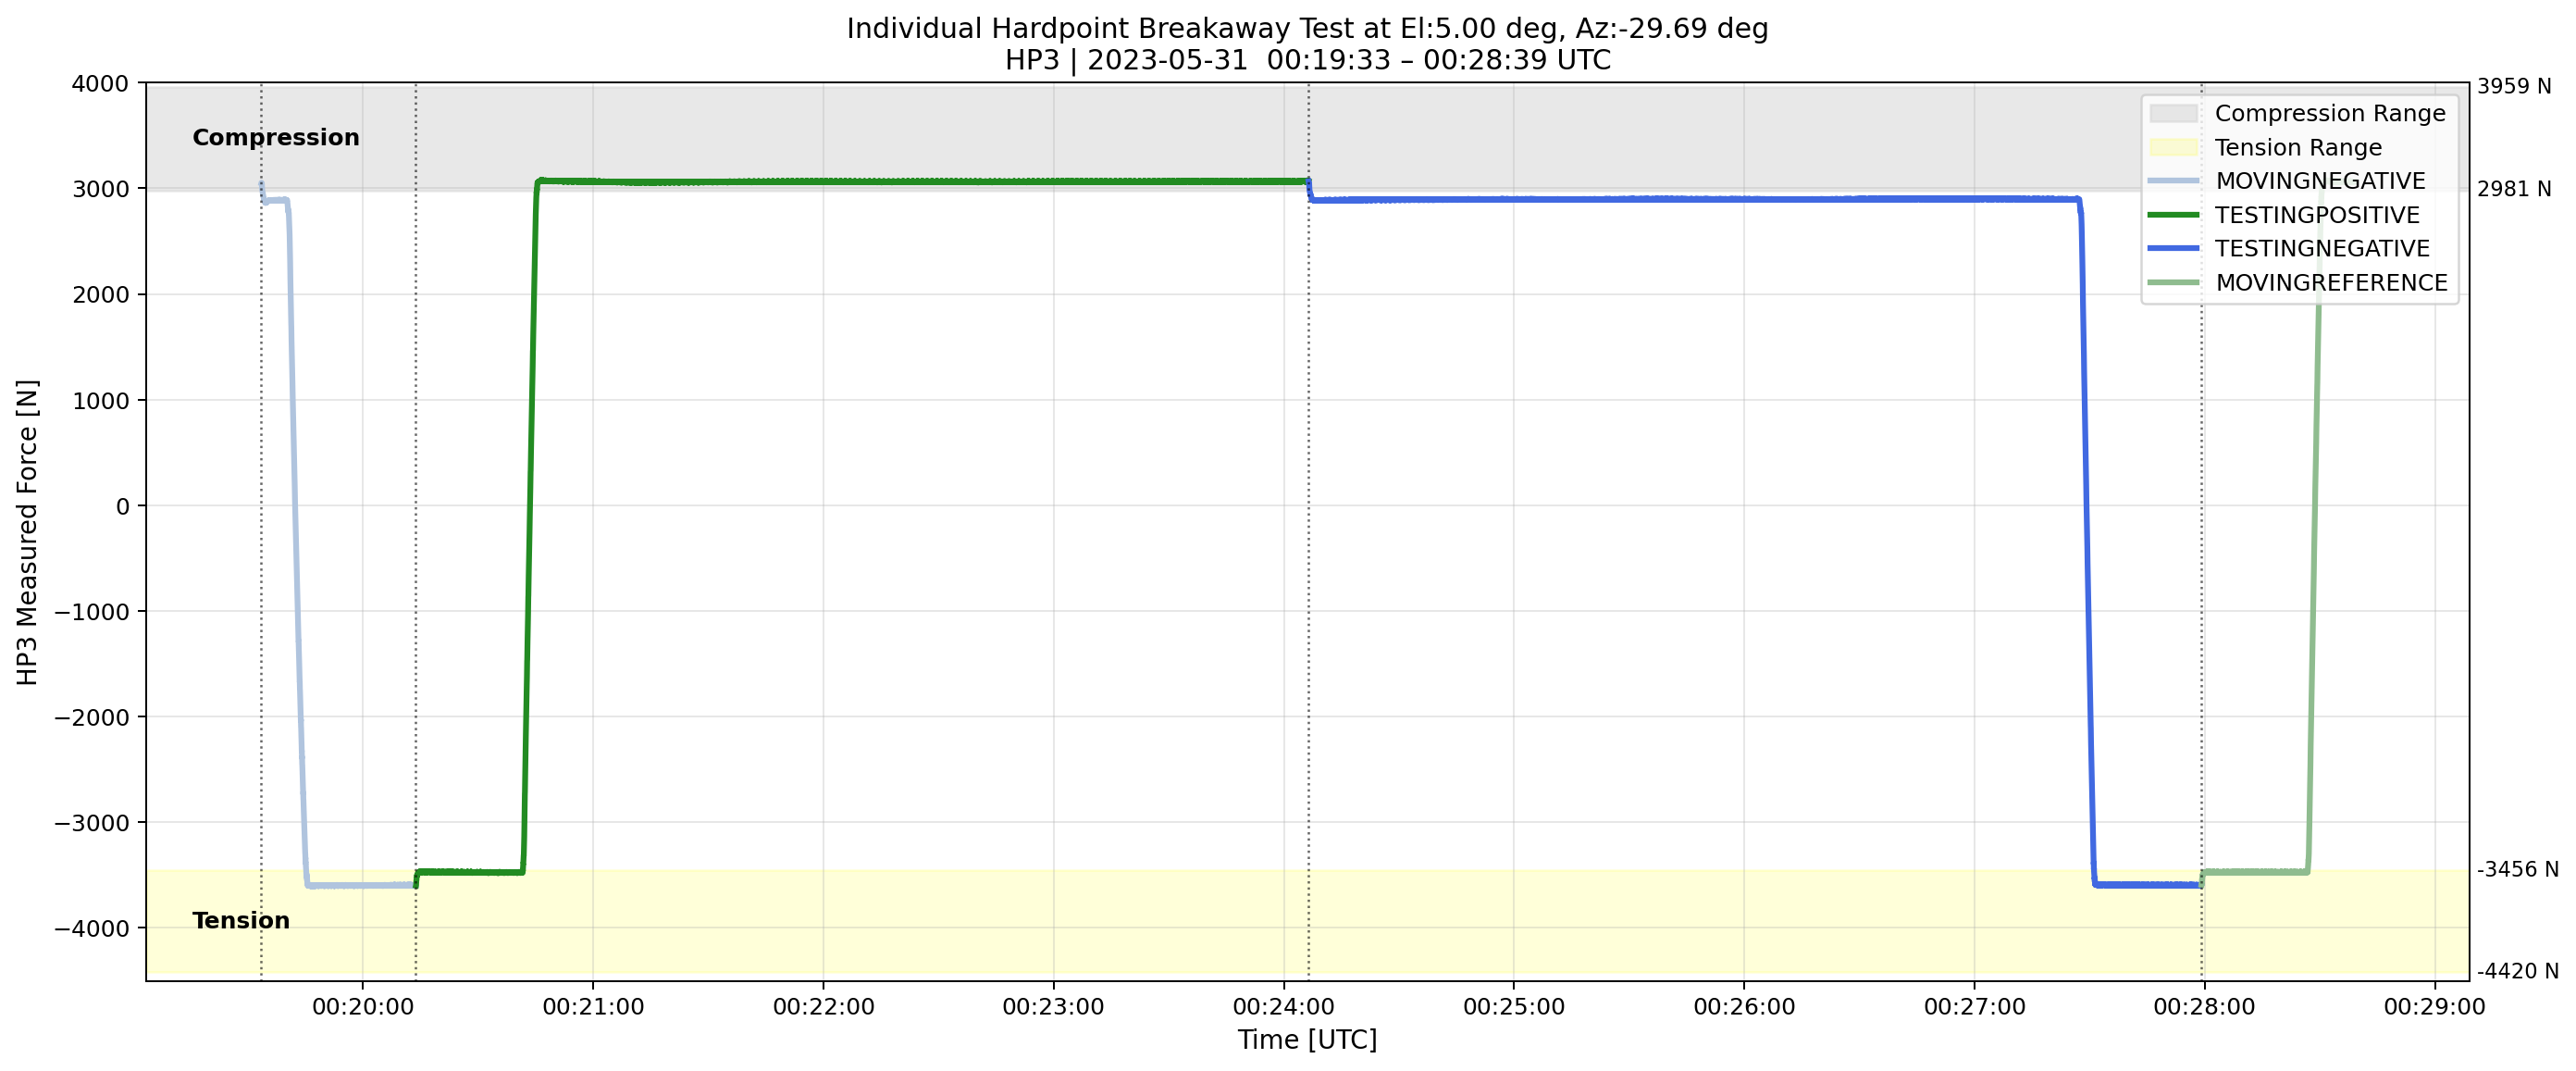
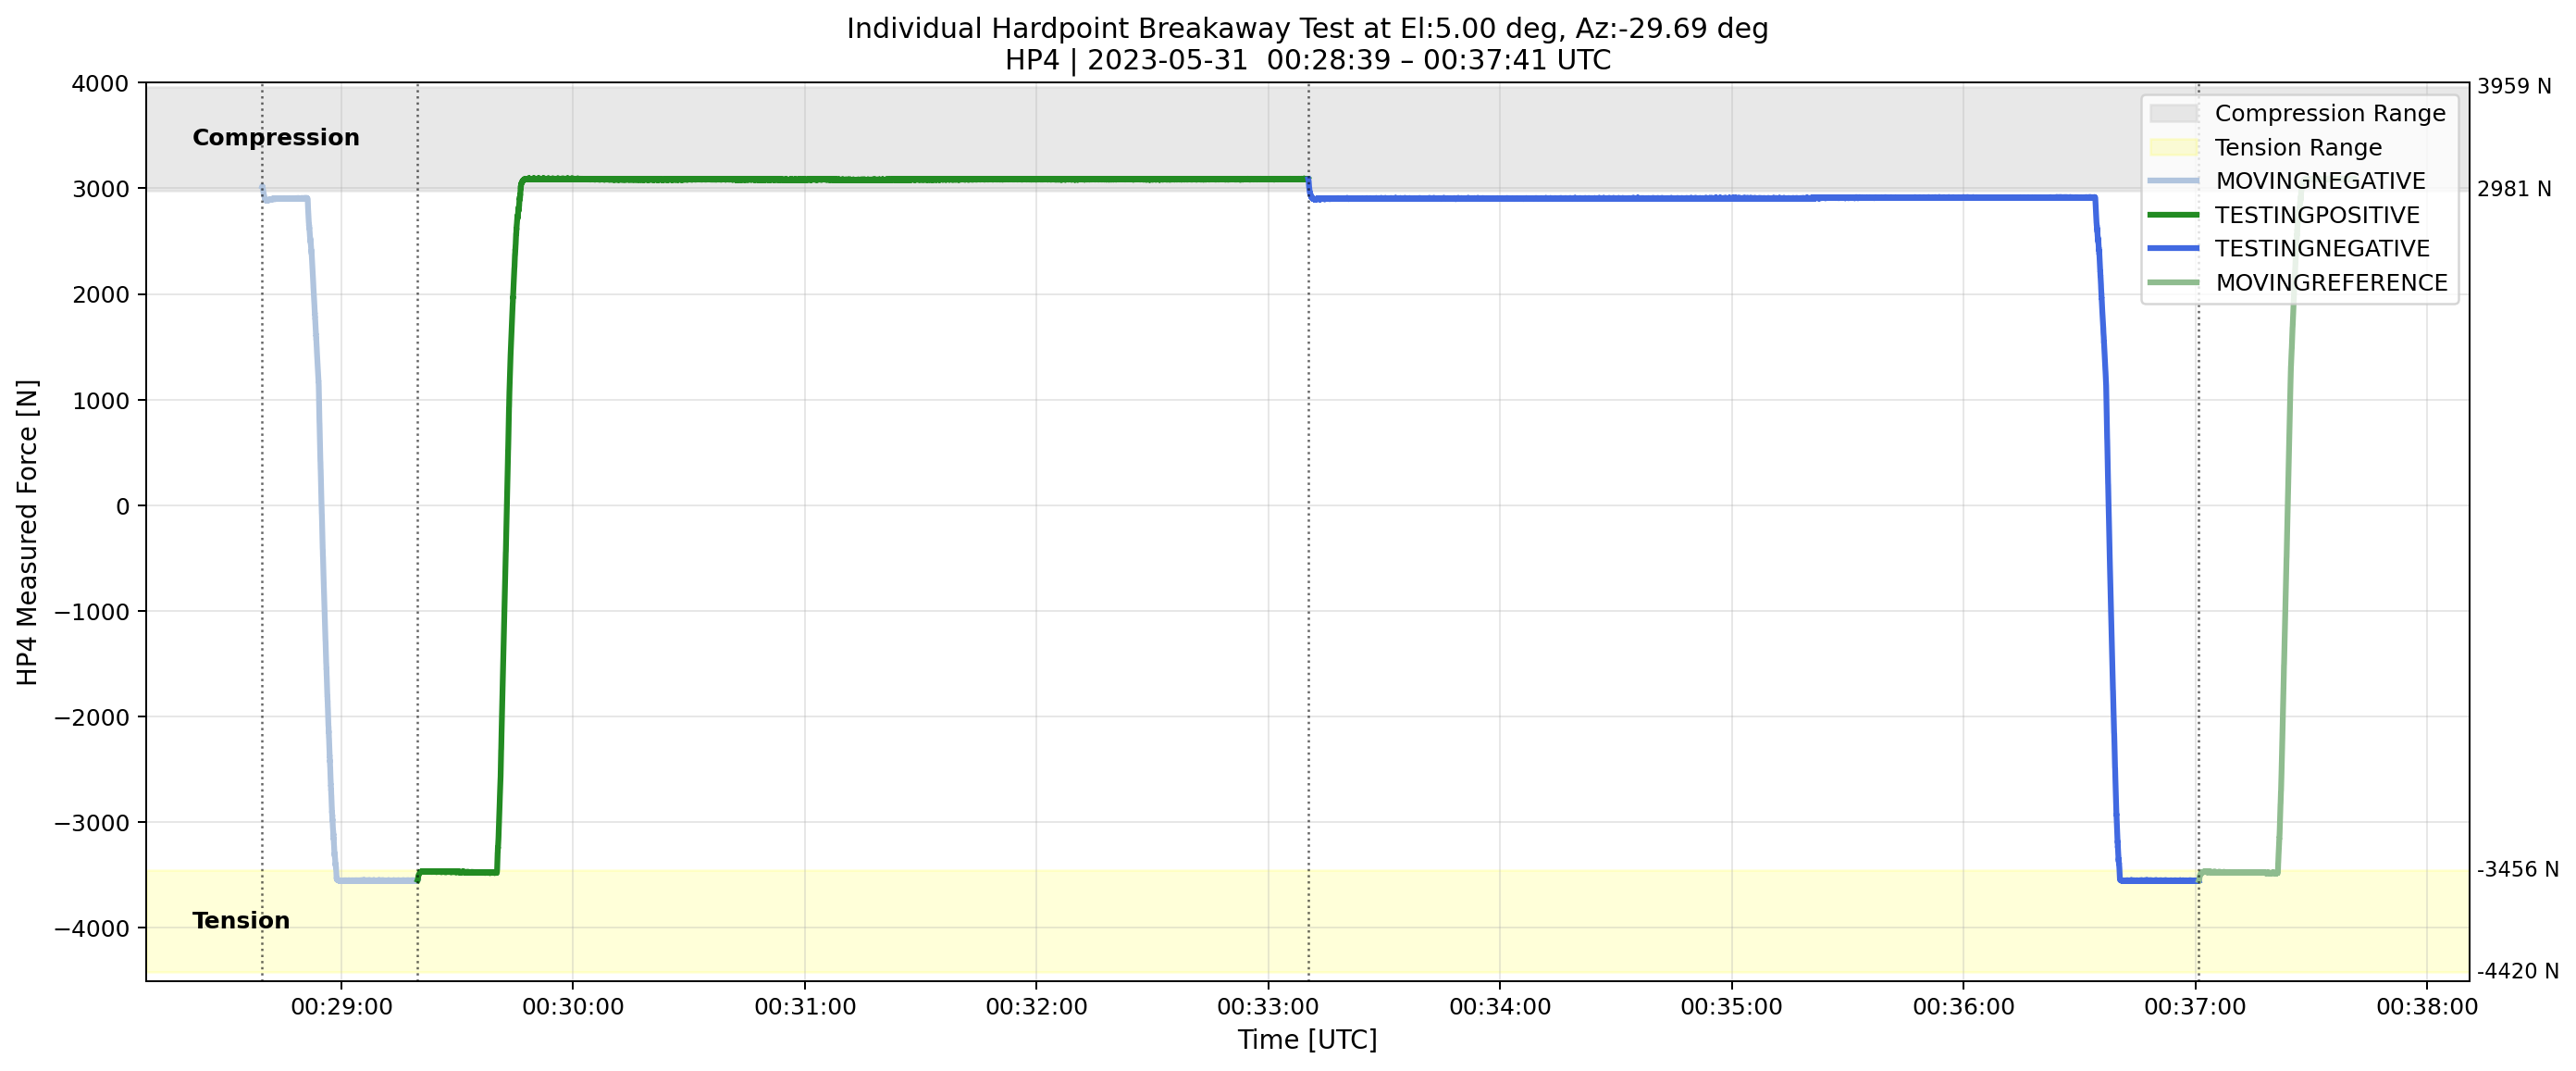
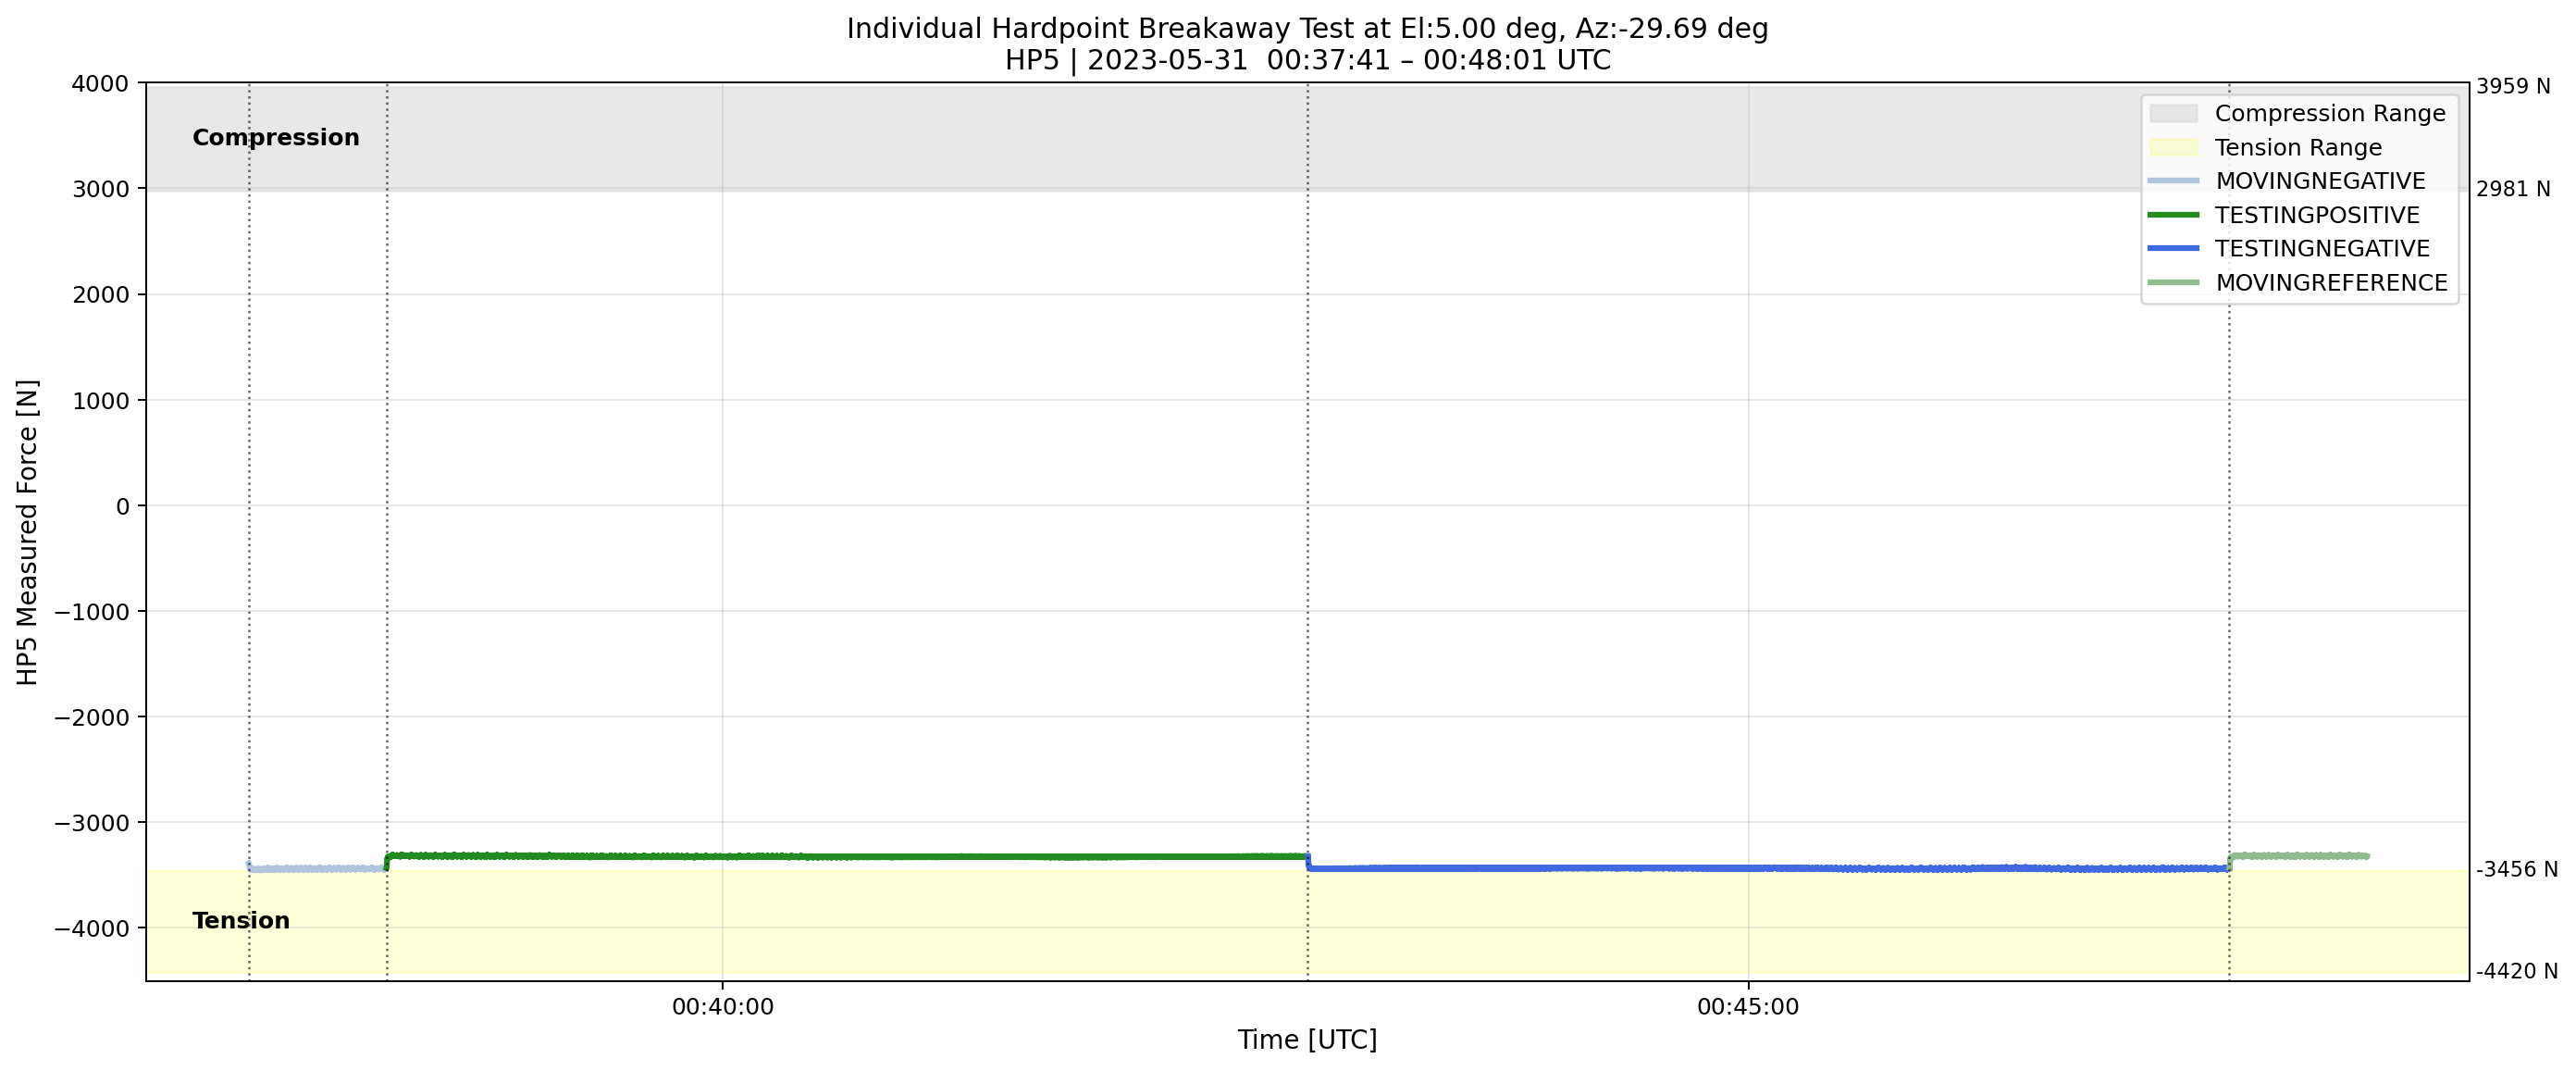
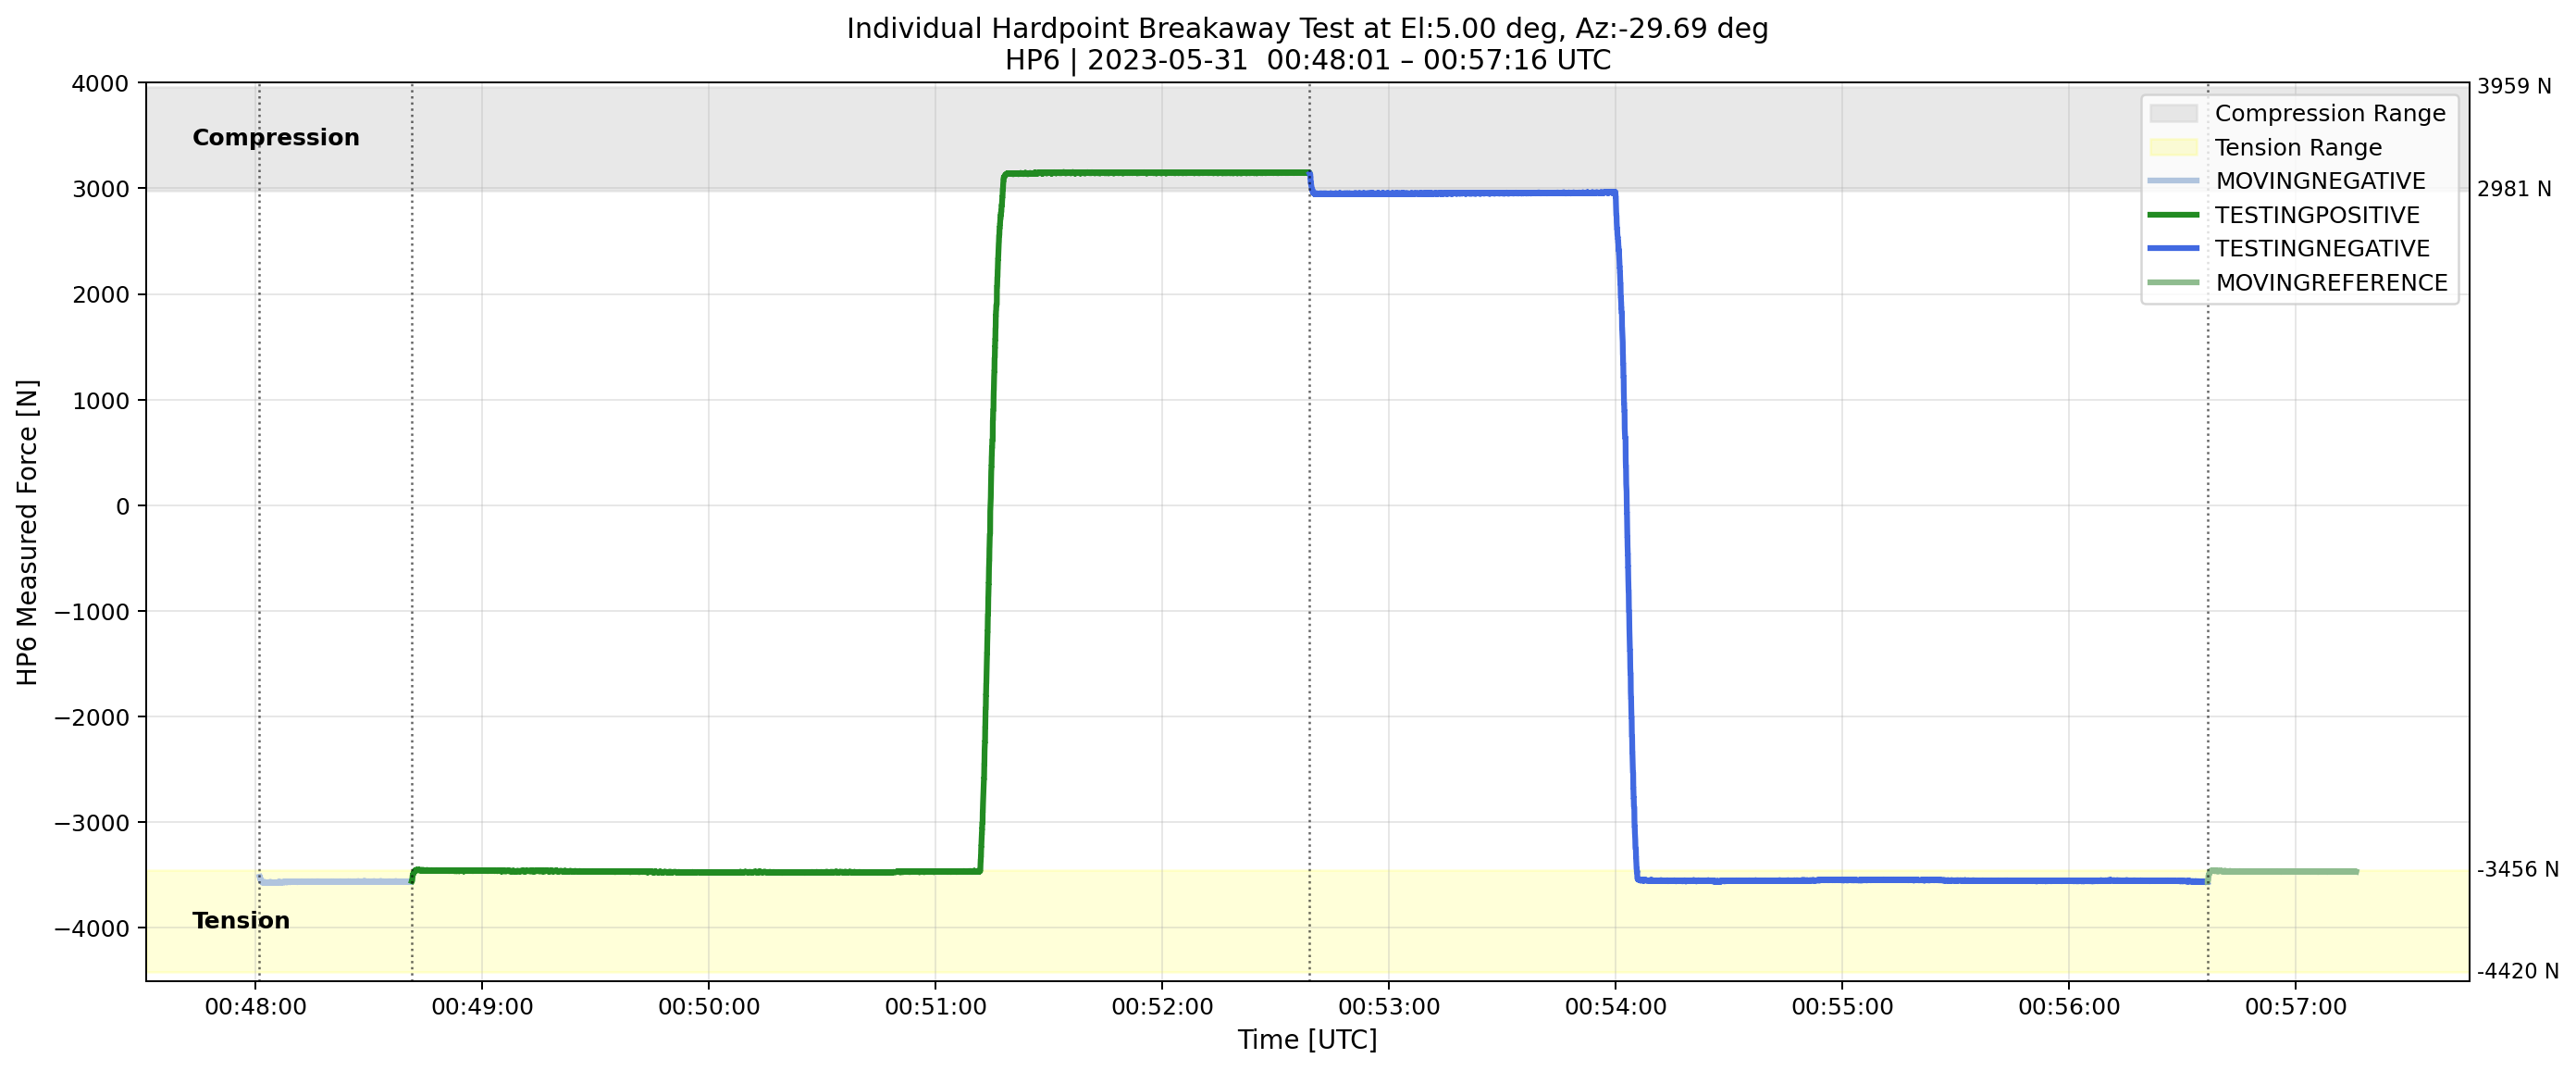
Fig. 16 Transition of the measured forces on each hardpoint when the TMA is at el=5deg.#
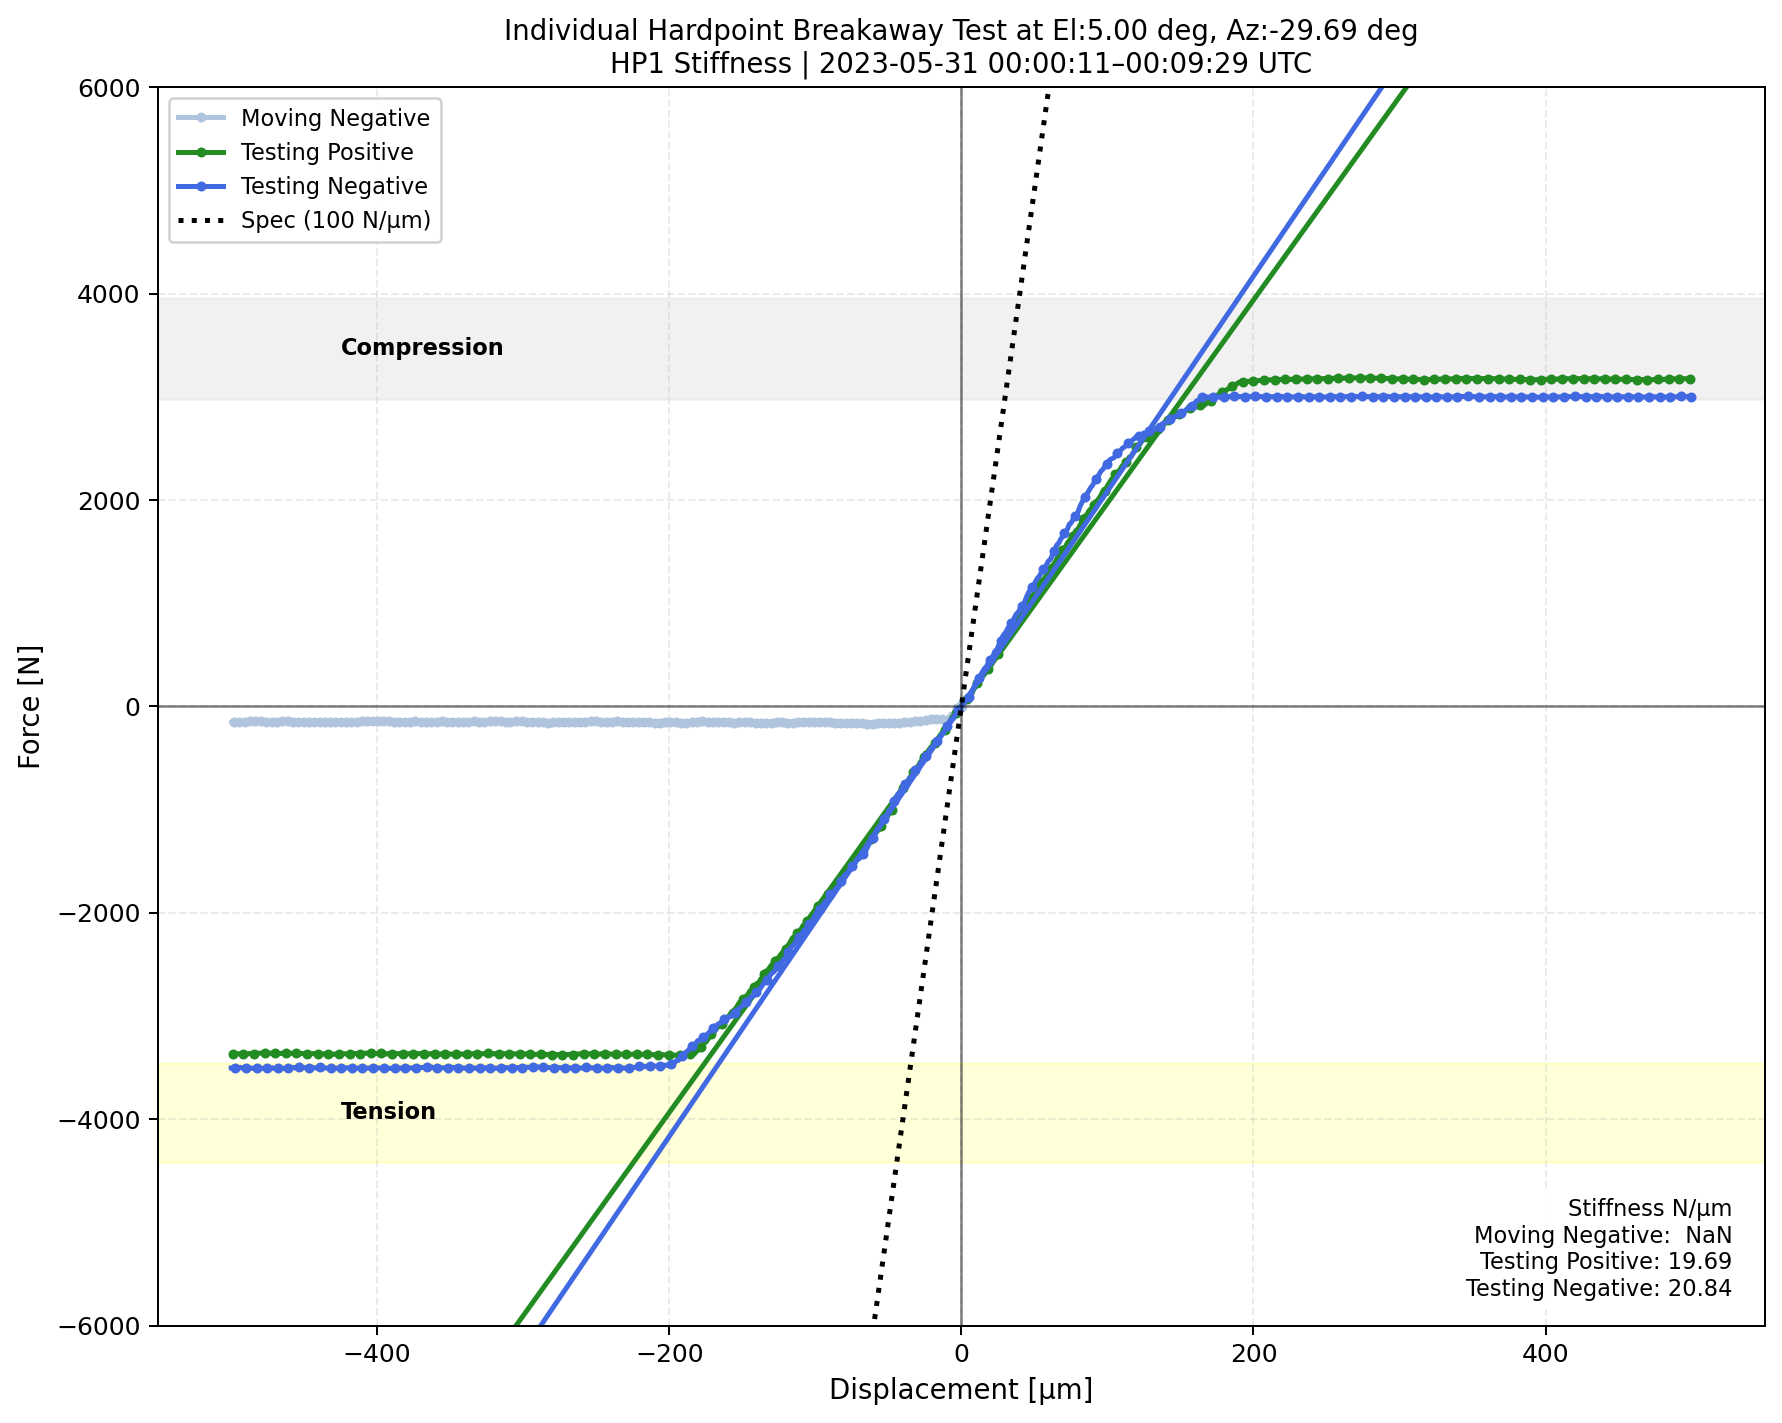
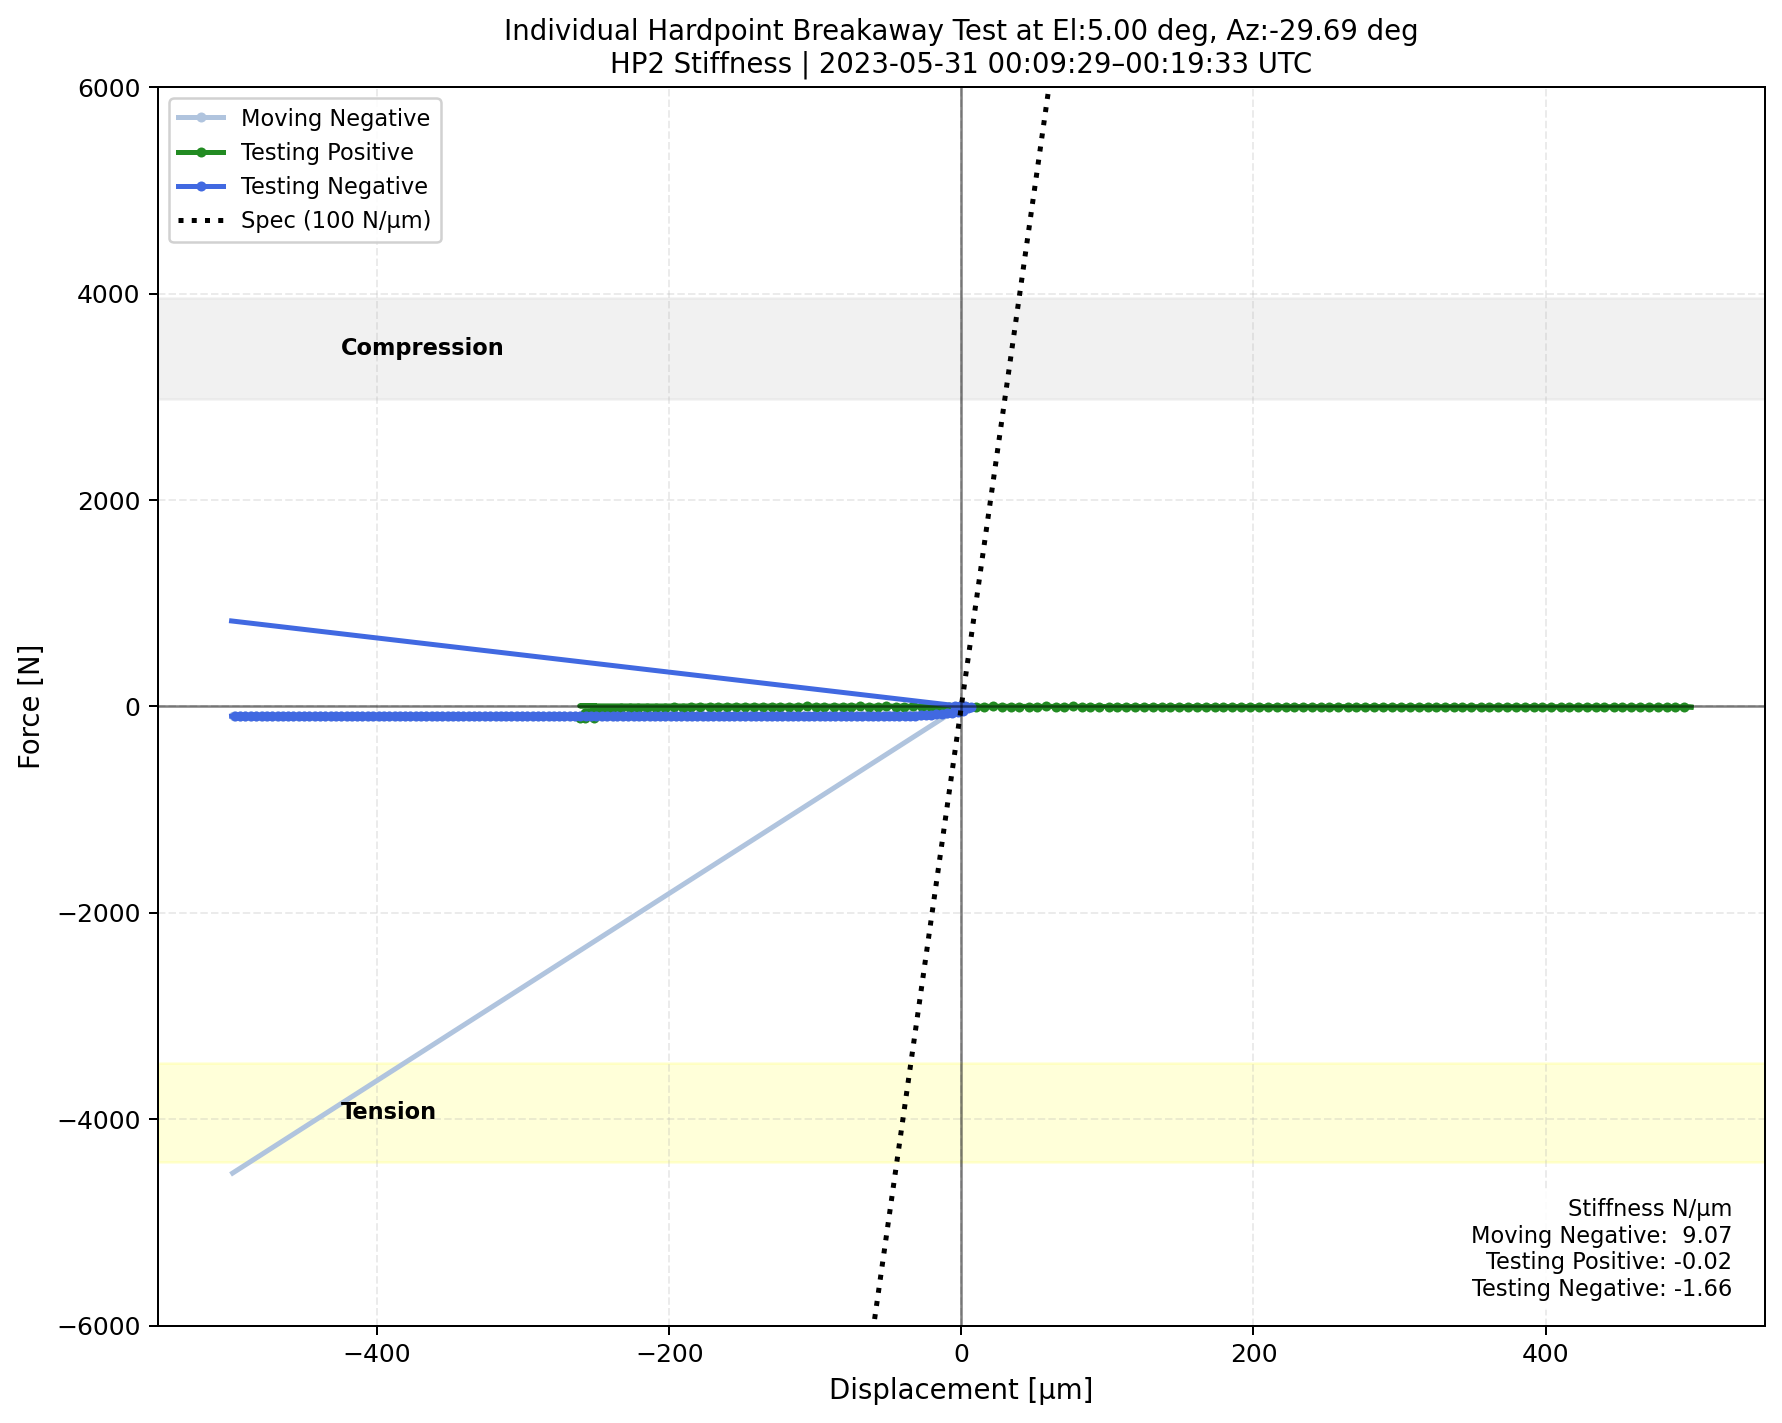
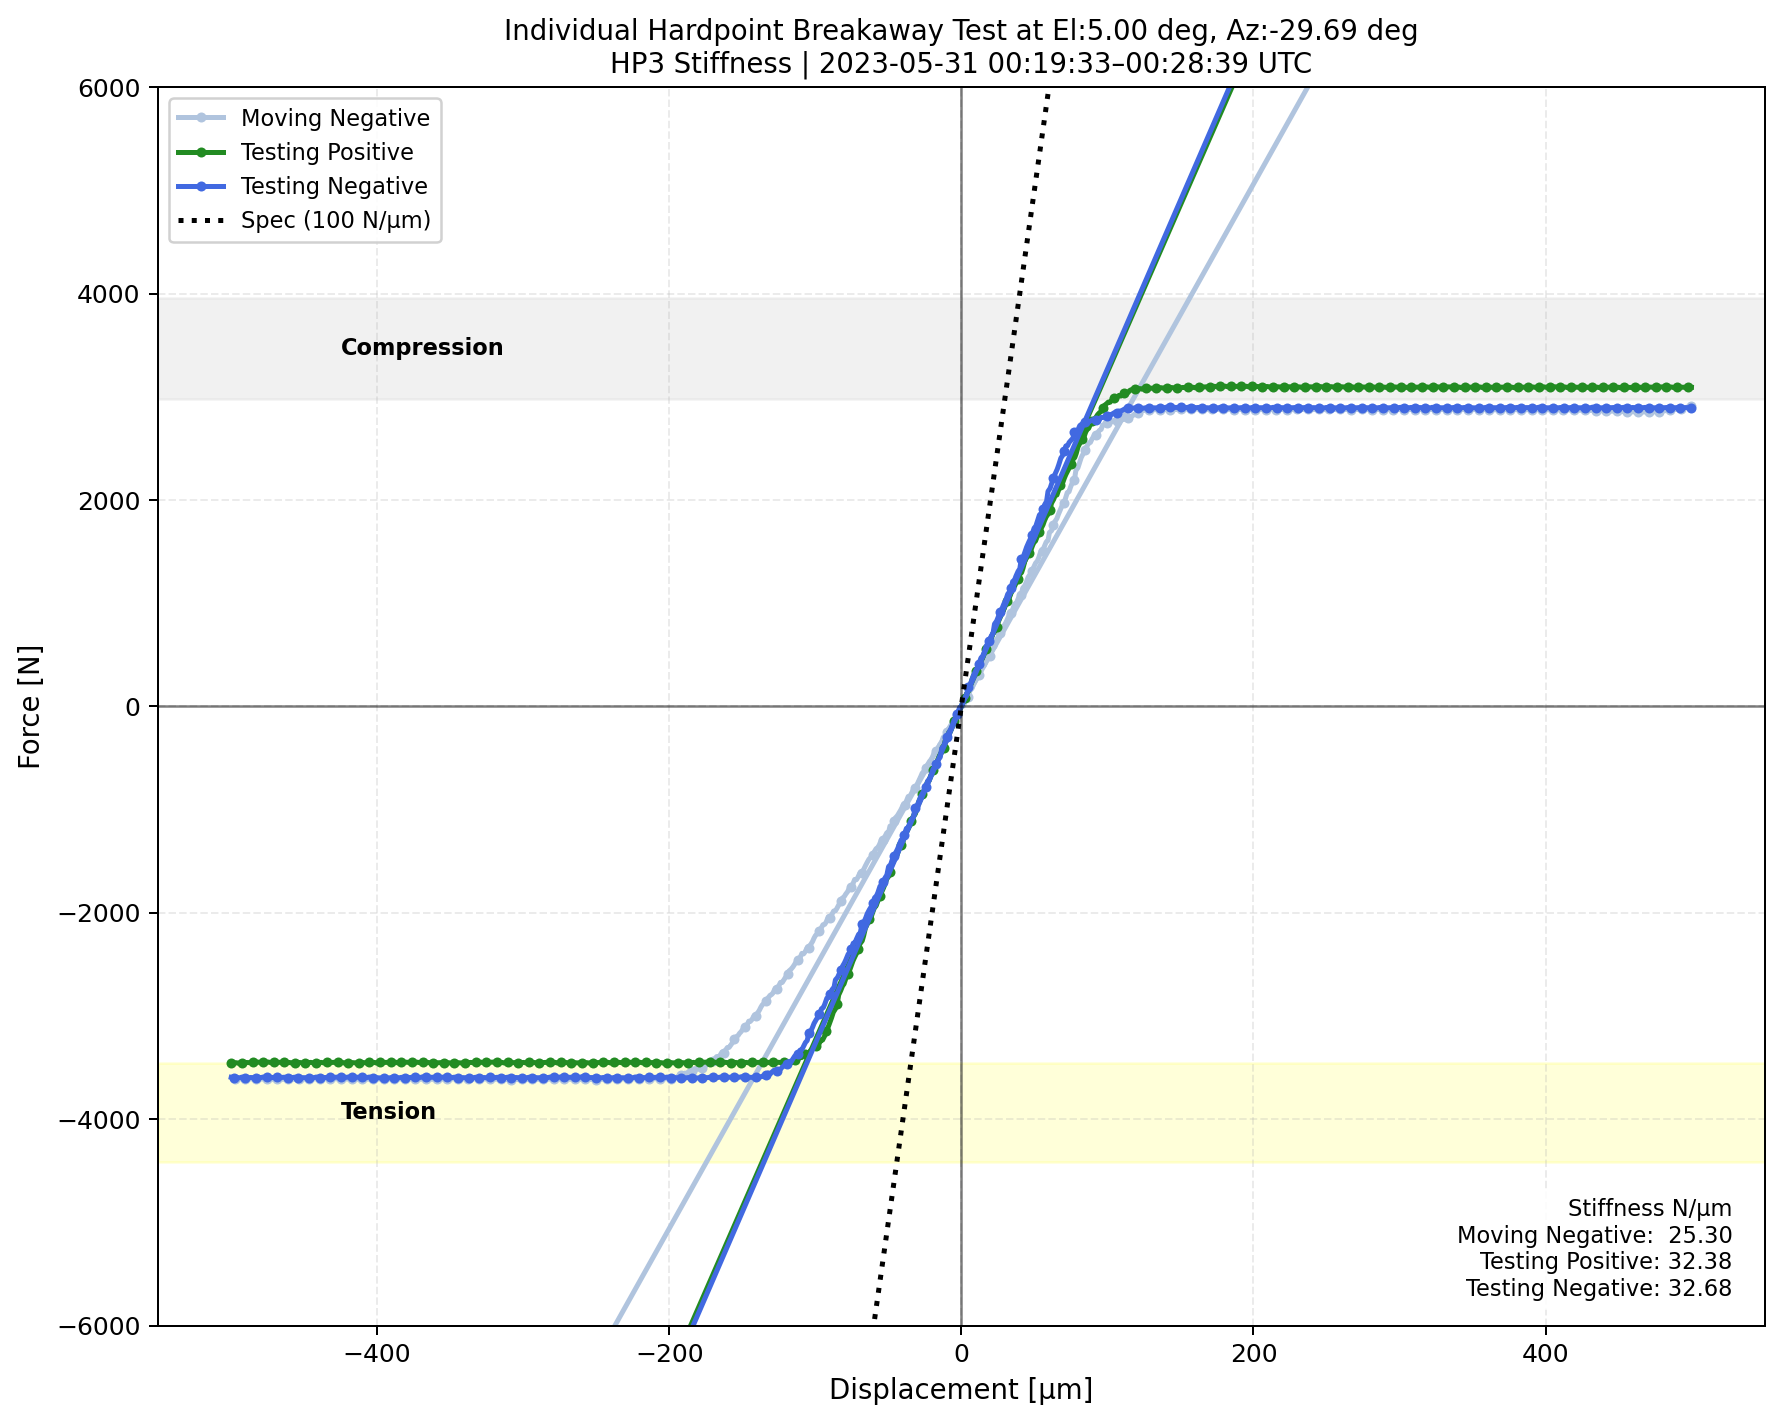
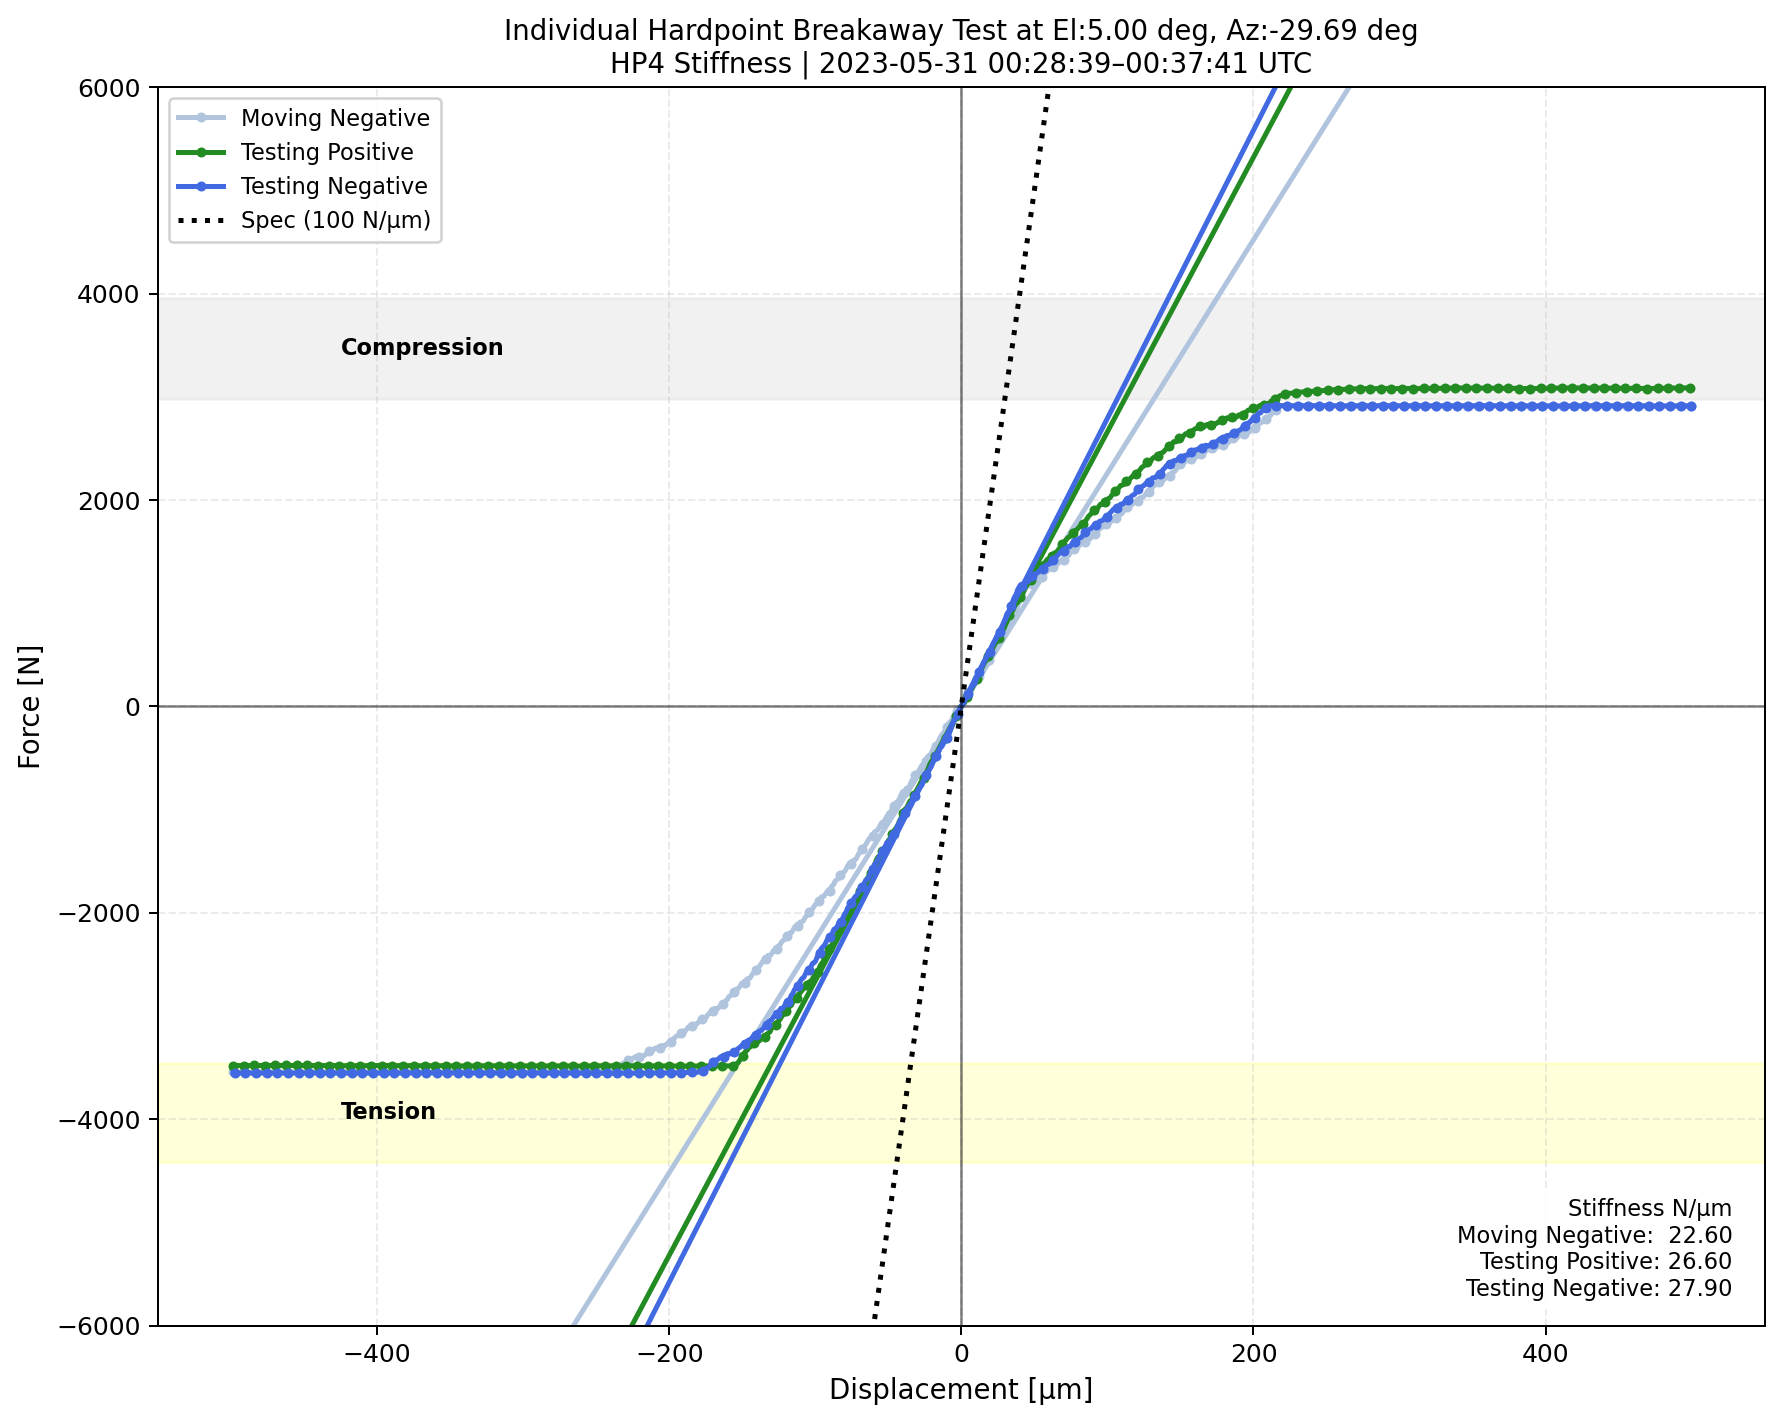
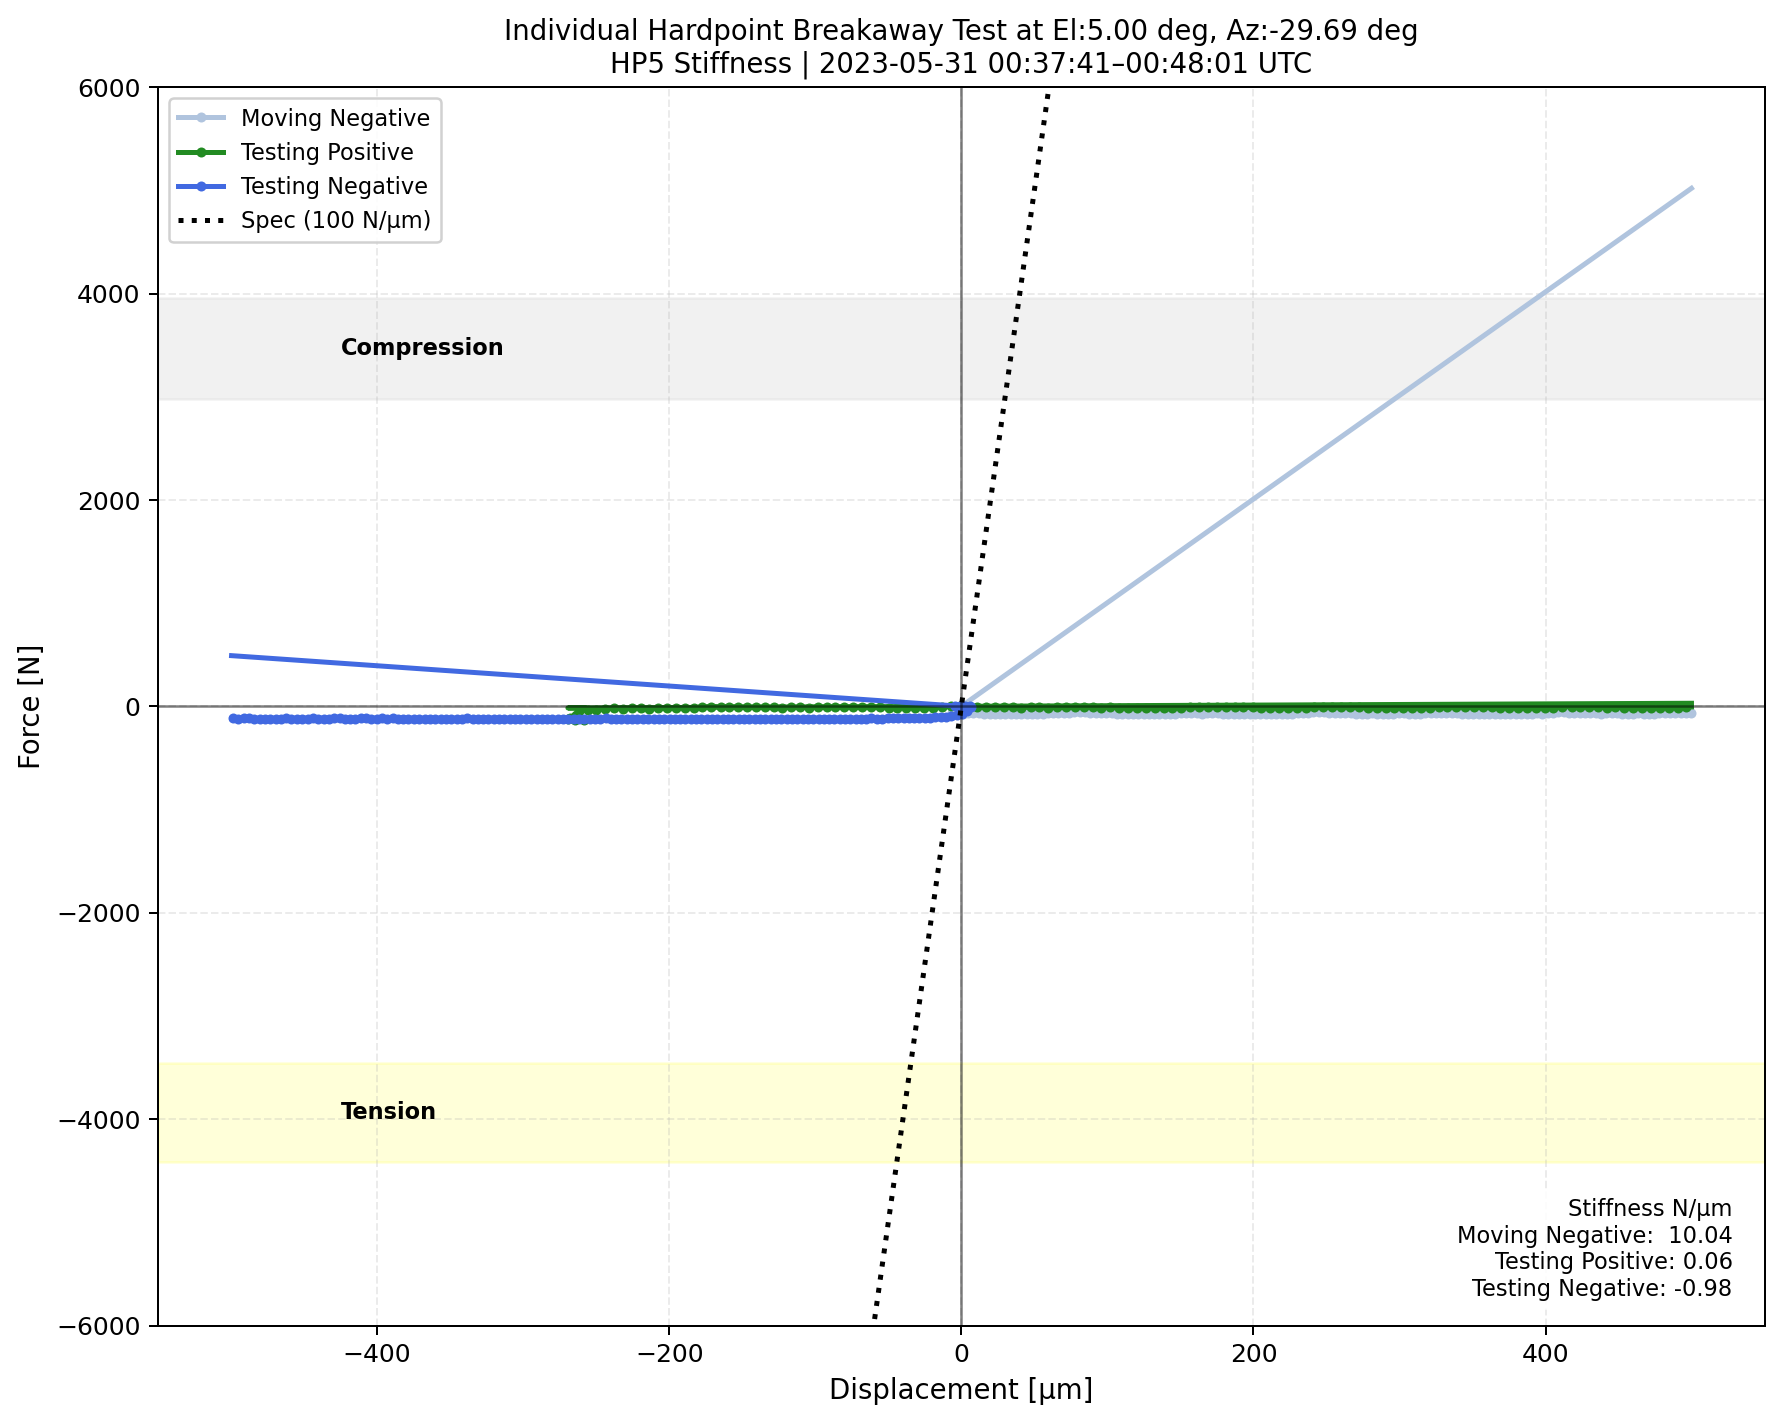
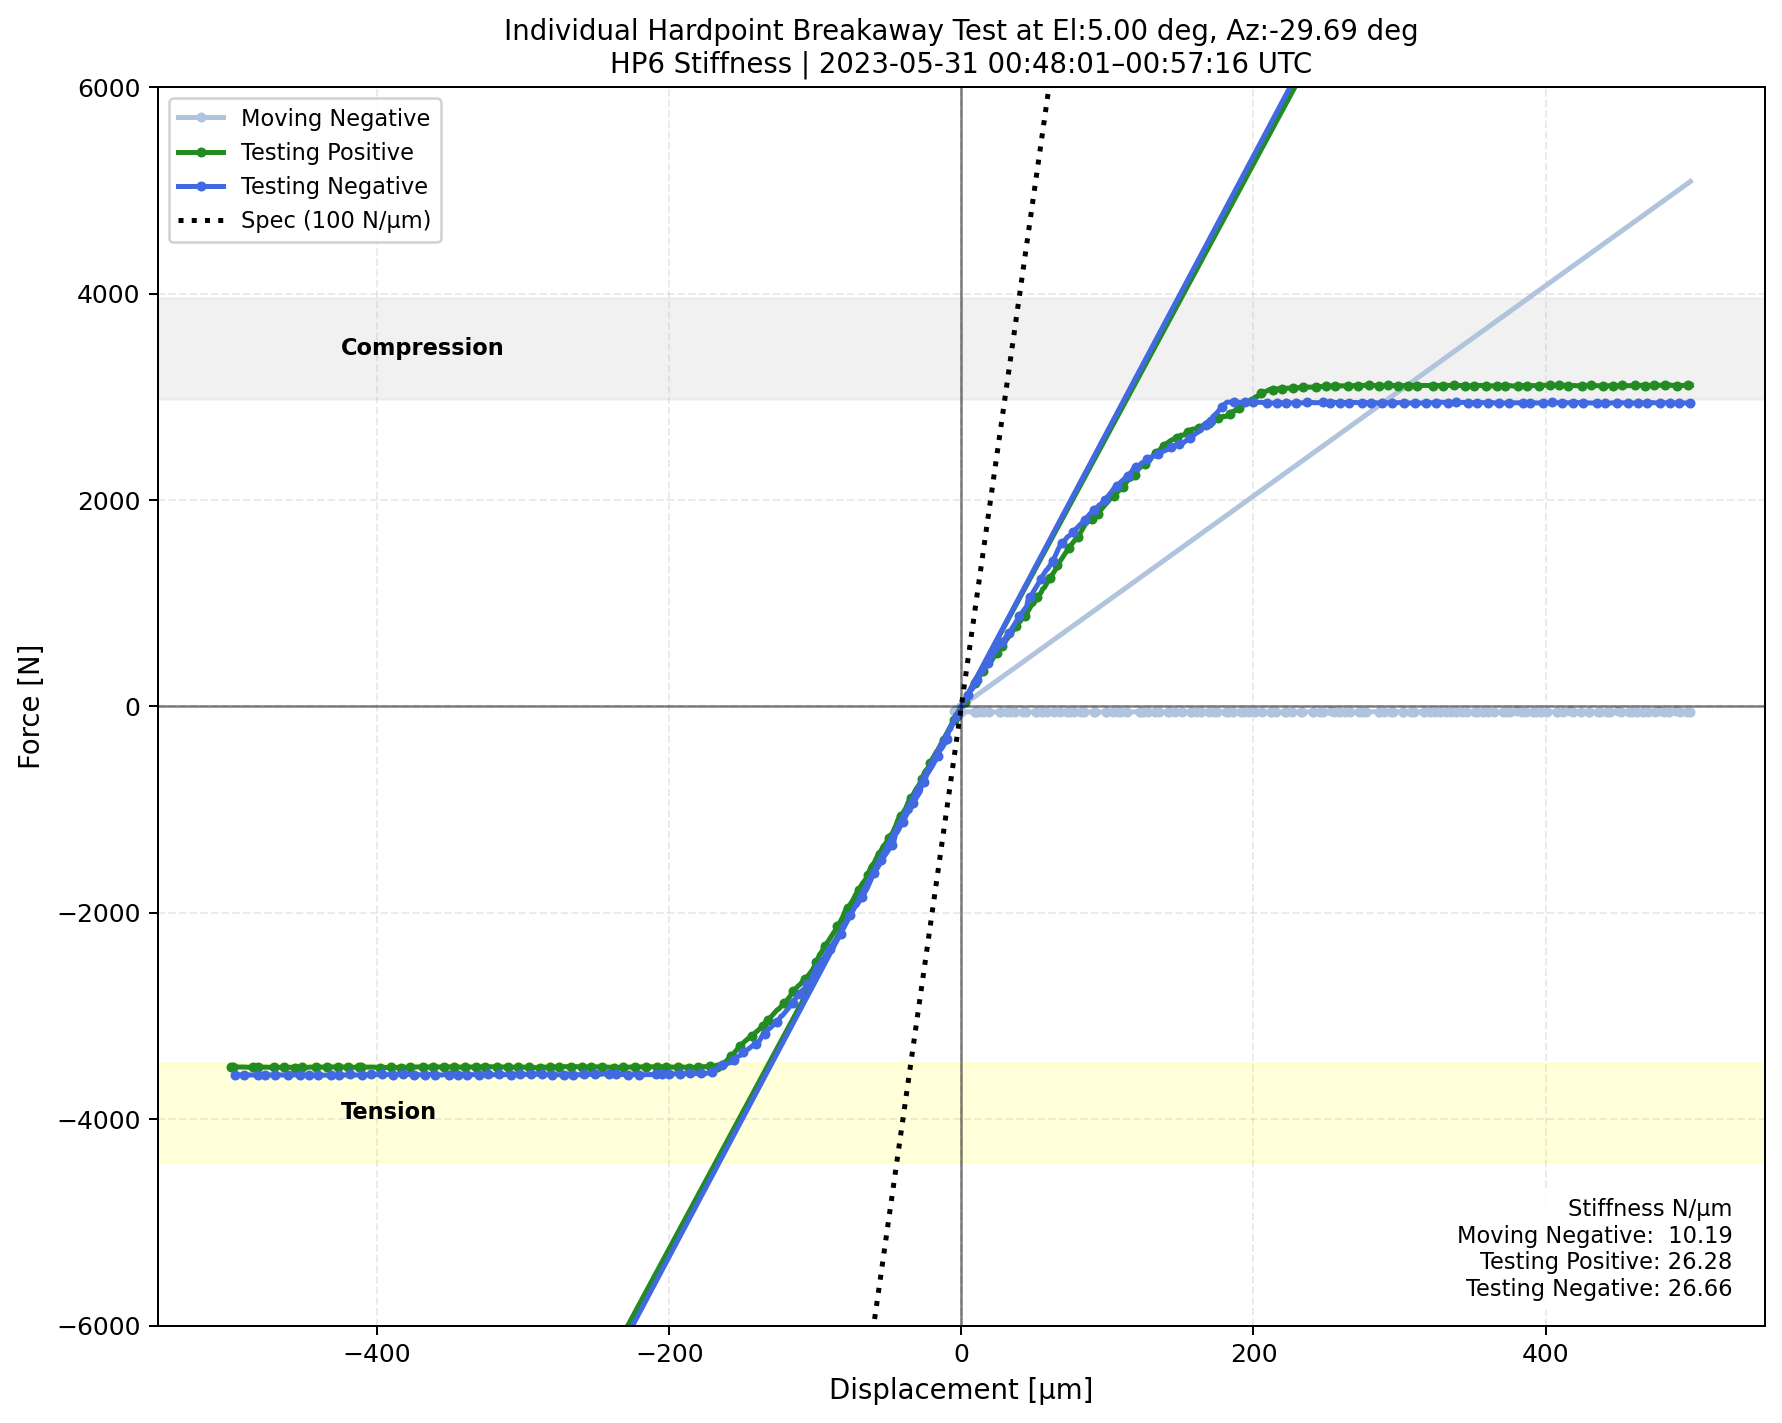
\(\Delta\)Displacement versus measured forces for each phase during the hardpoint breakaway test when the TMA is at el=5 deg.


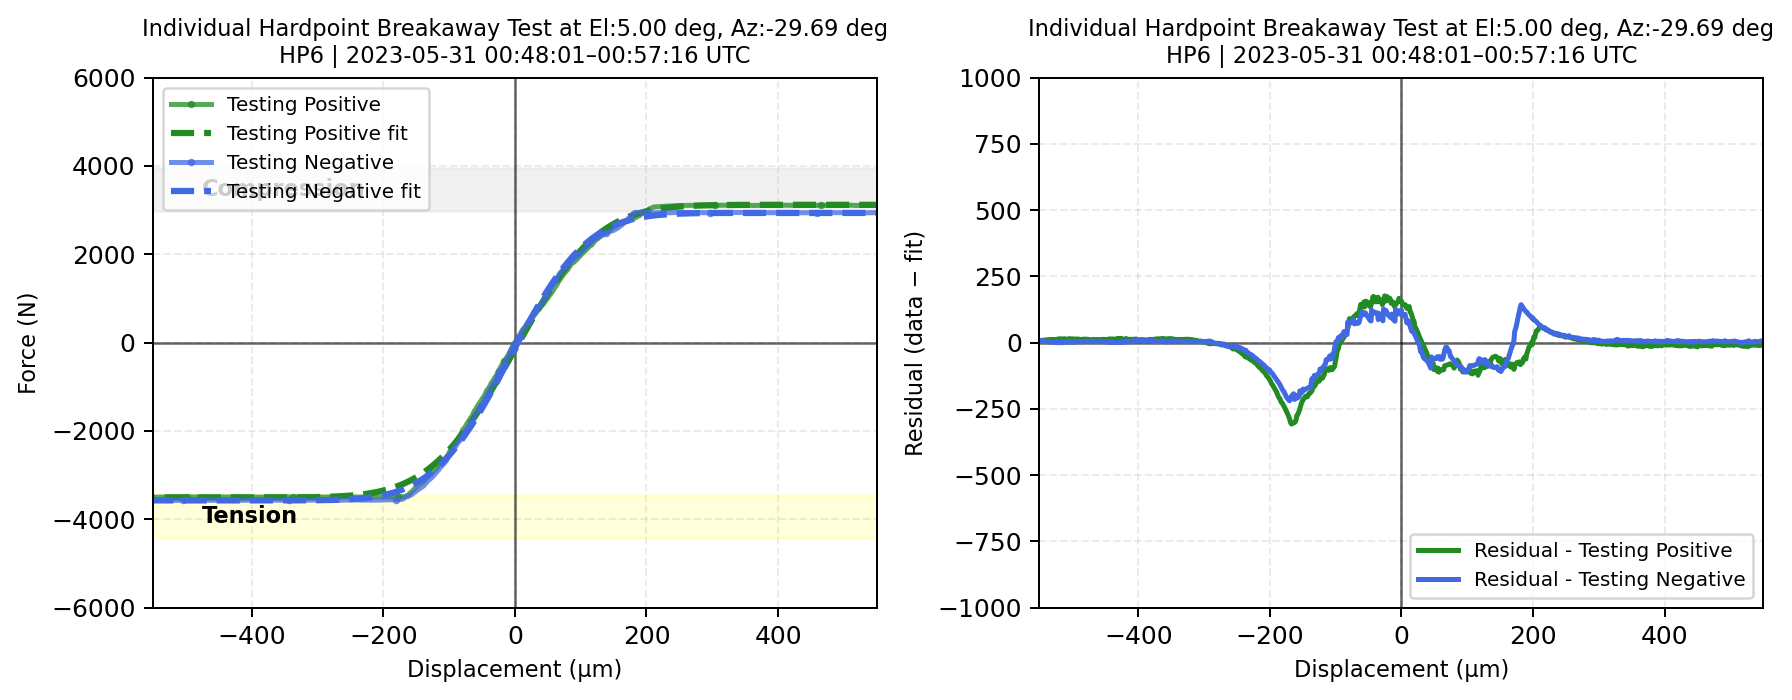
Fig. 17 (Left) \(\Delta\)Displacement versus measured forces for each phase during the hardpoint breakaway test fit with error function (the TMA at el=5deg). (Right) The residual, a difference between data and error function, with respect to \(\Delta\)displacement#
HP Test at el 1 deg#
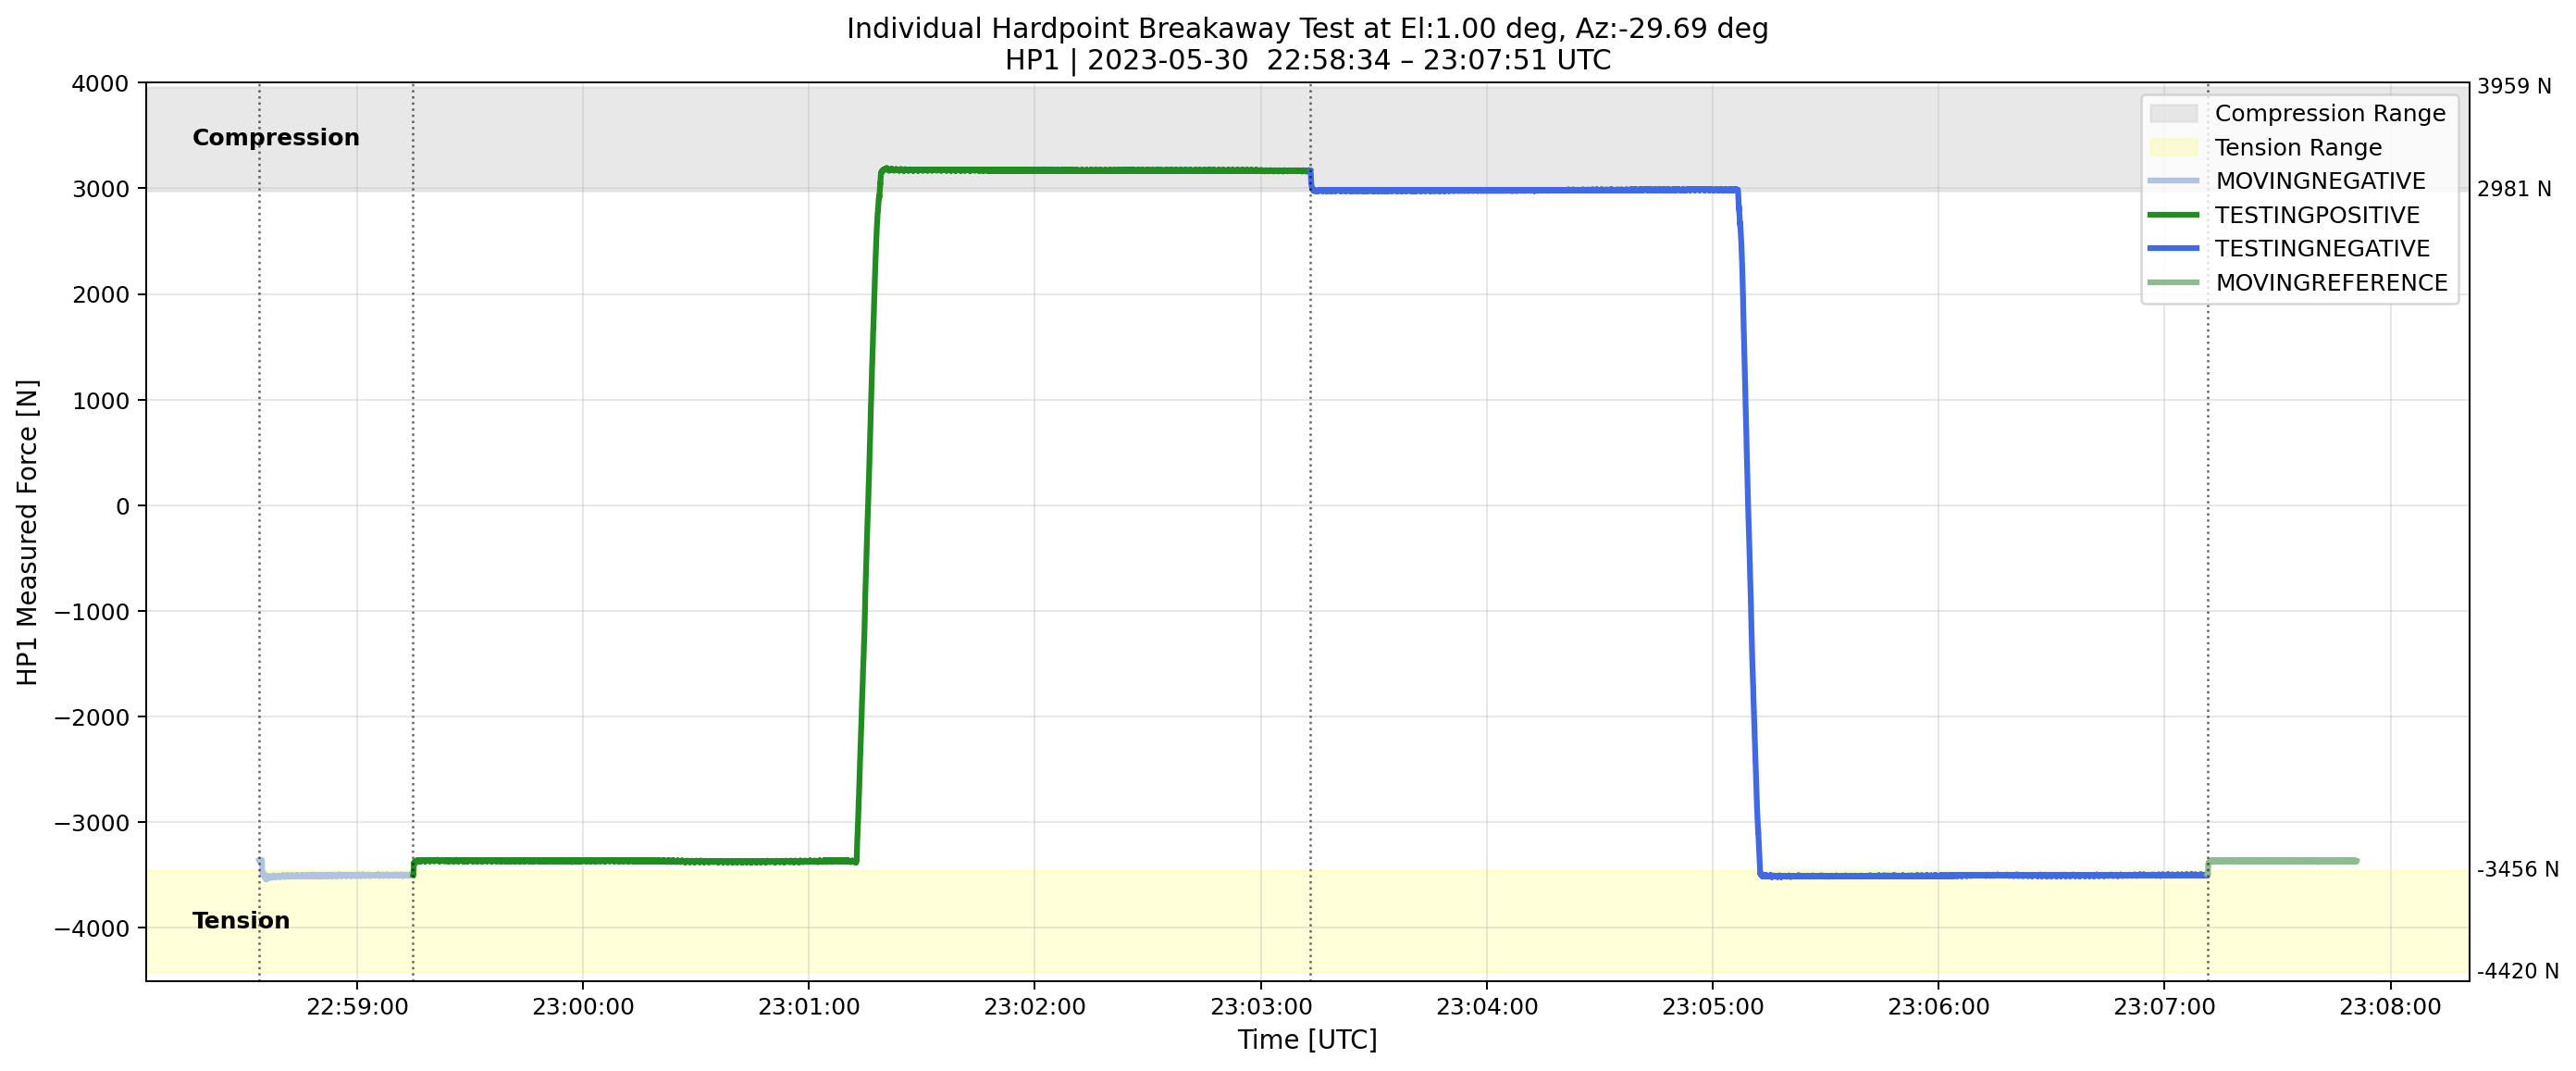
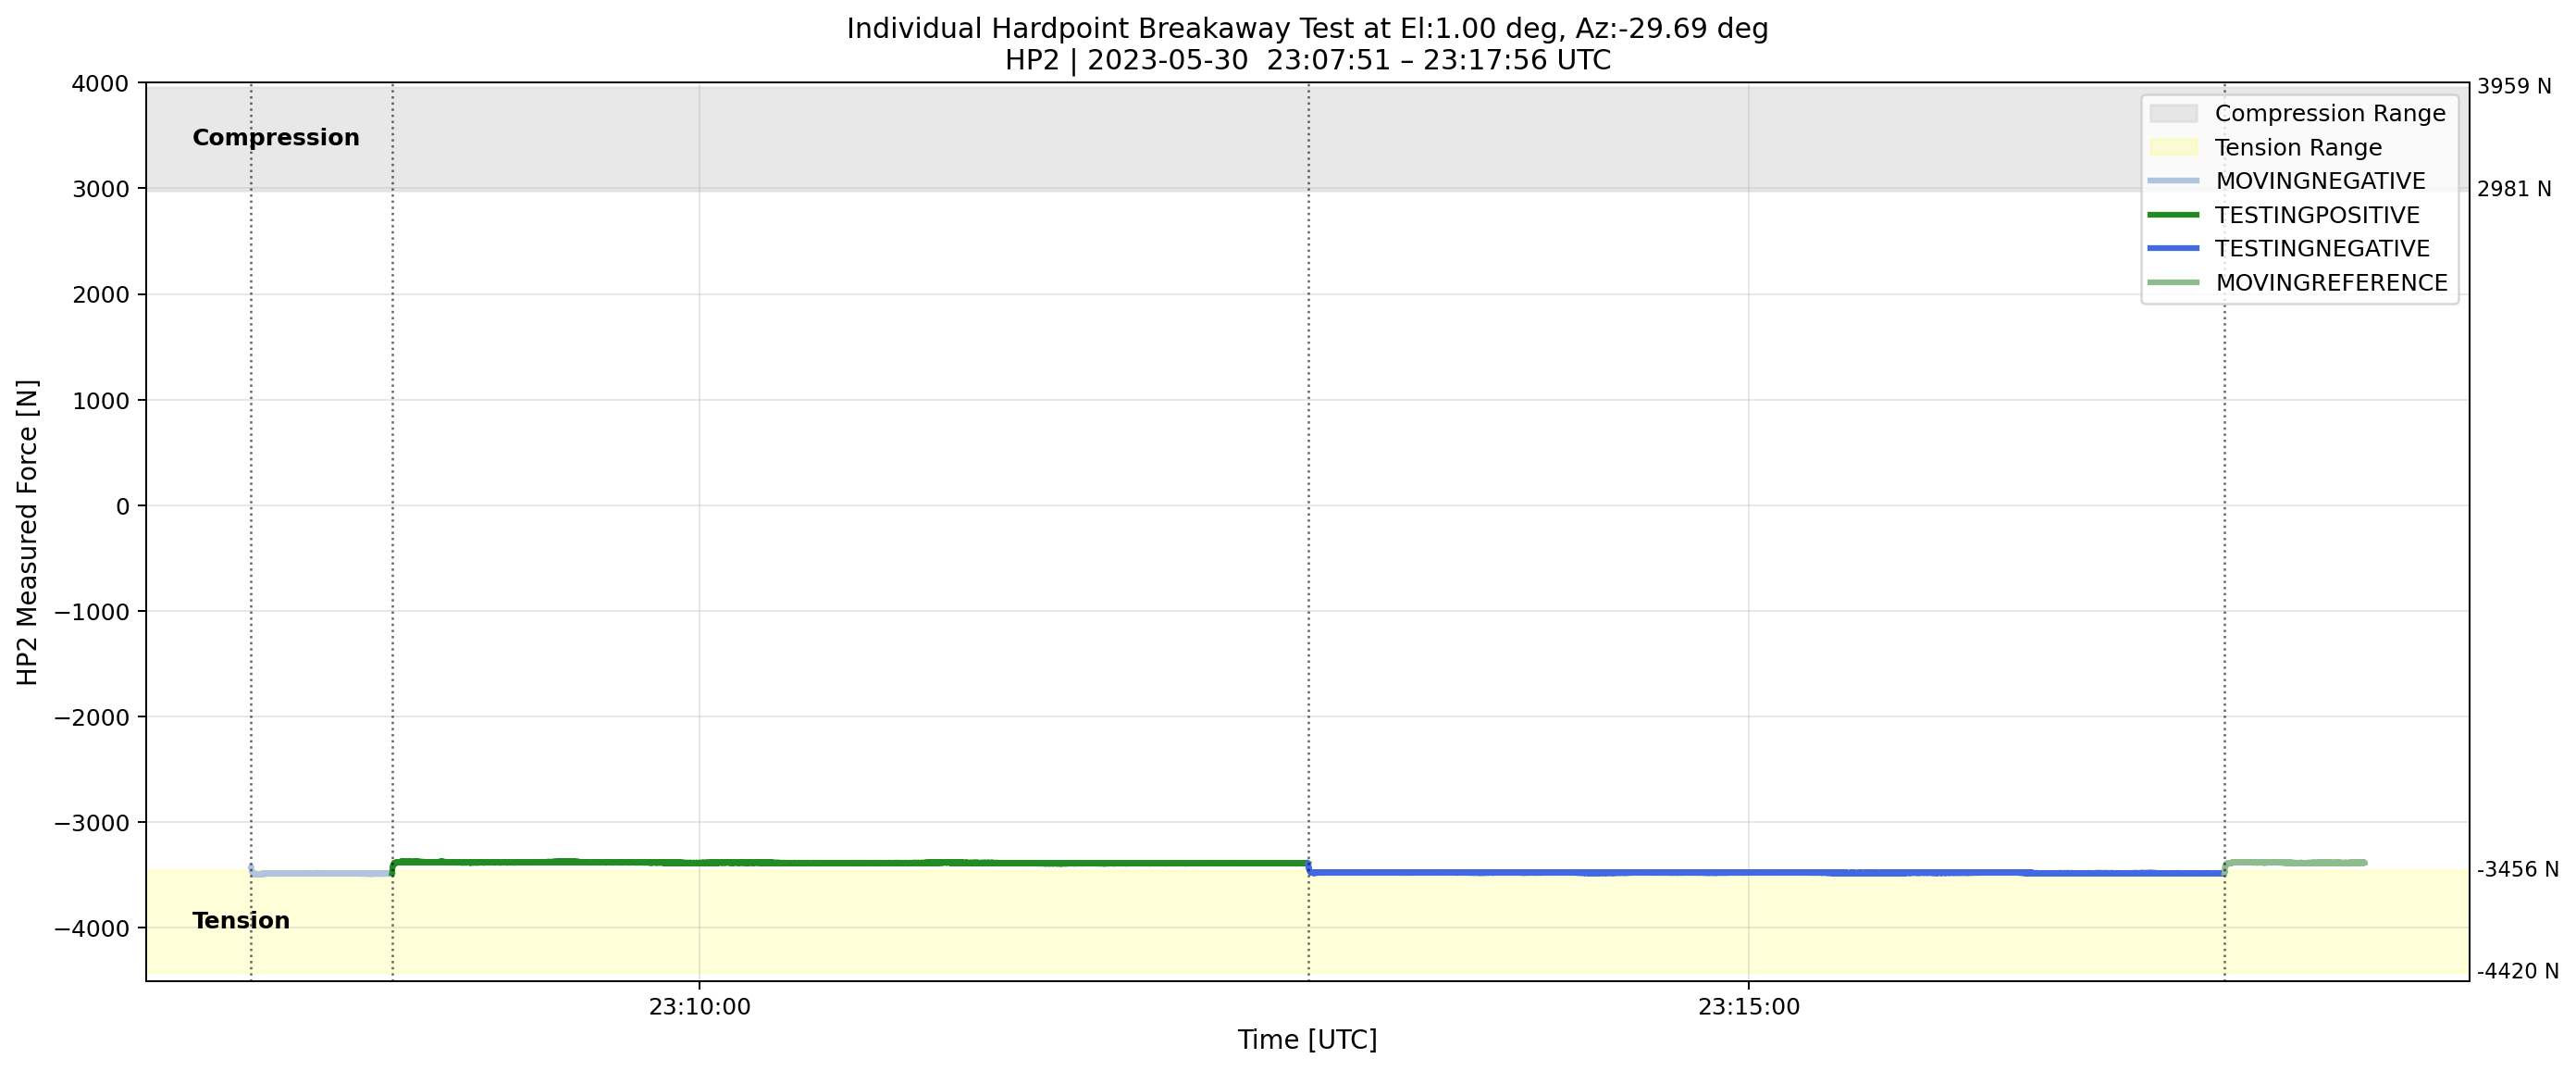
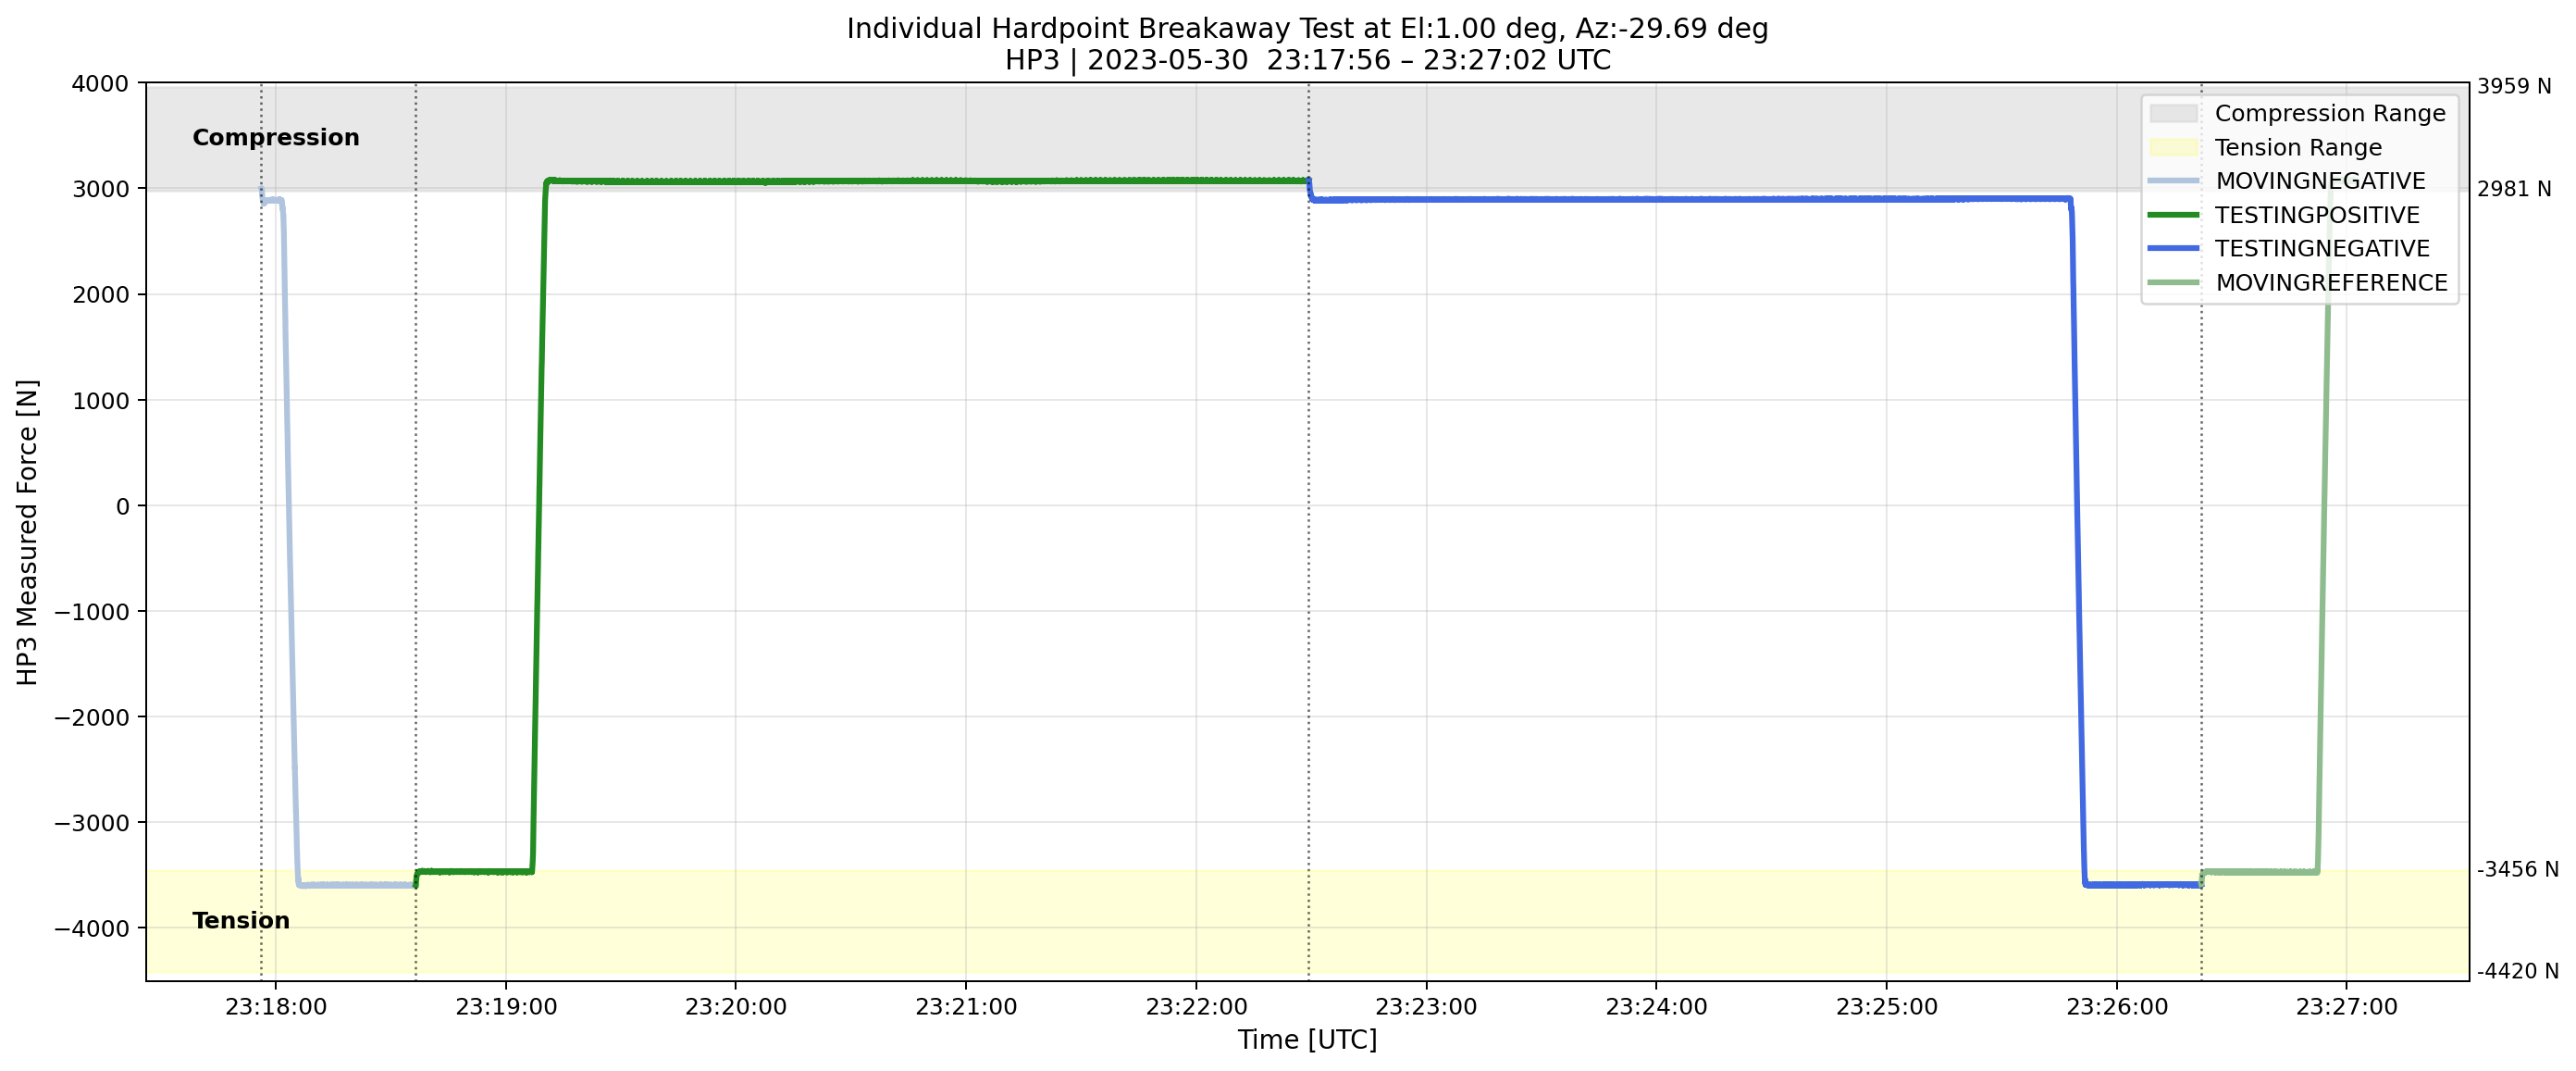
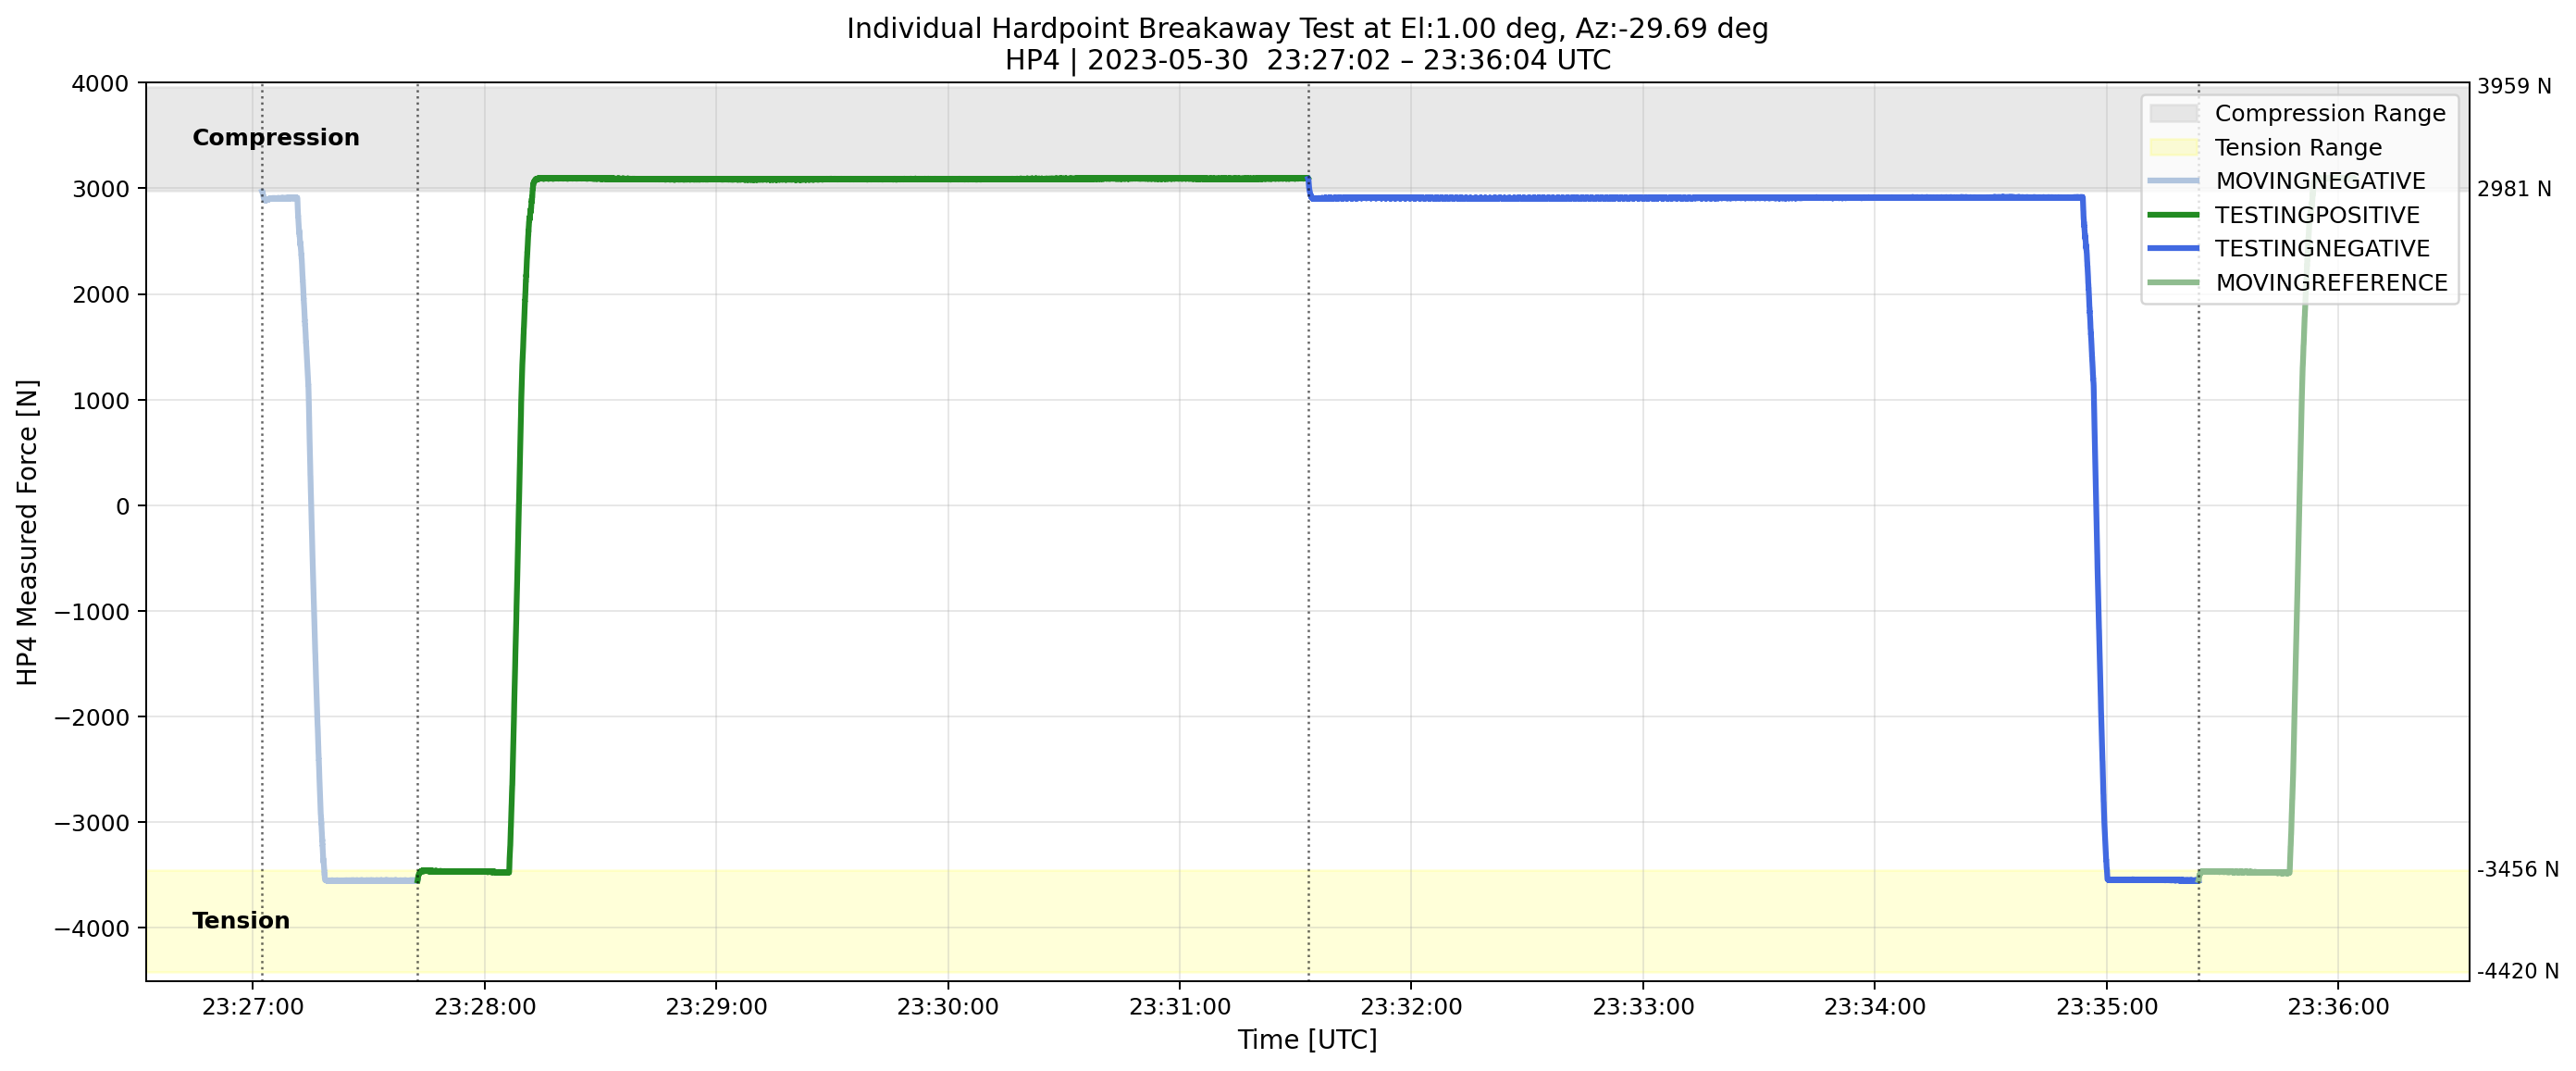
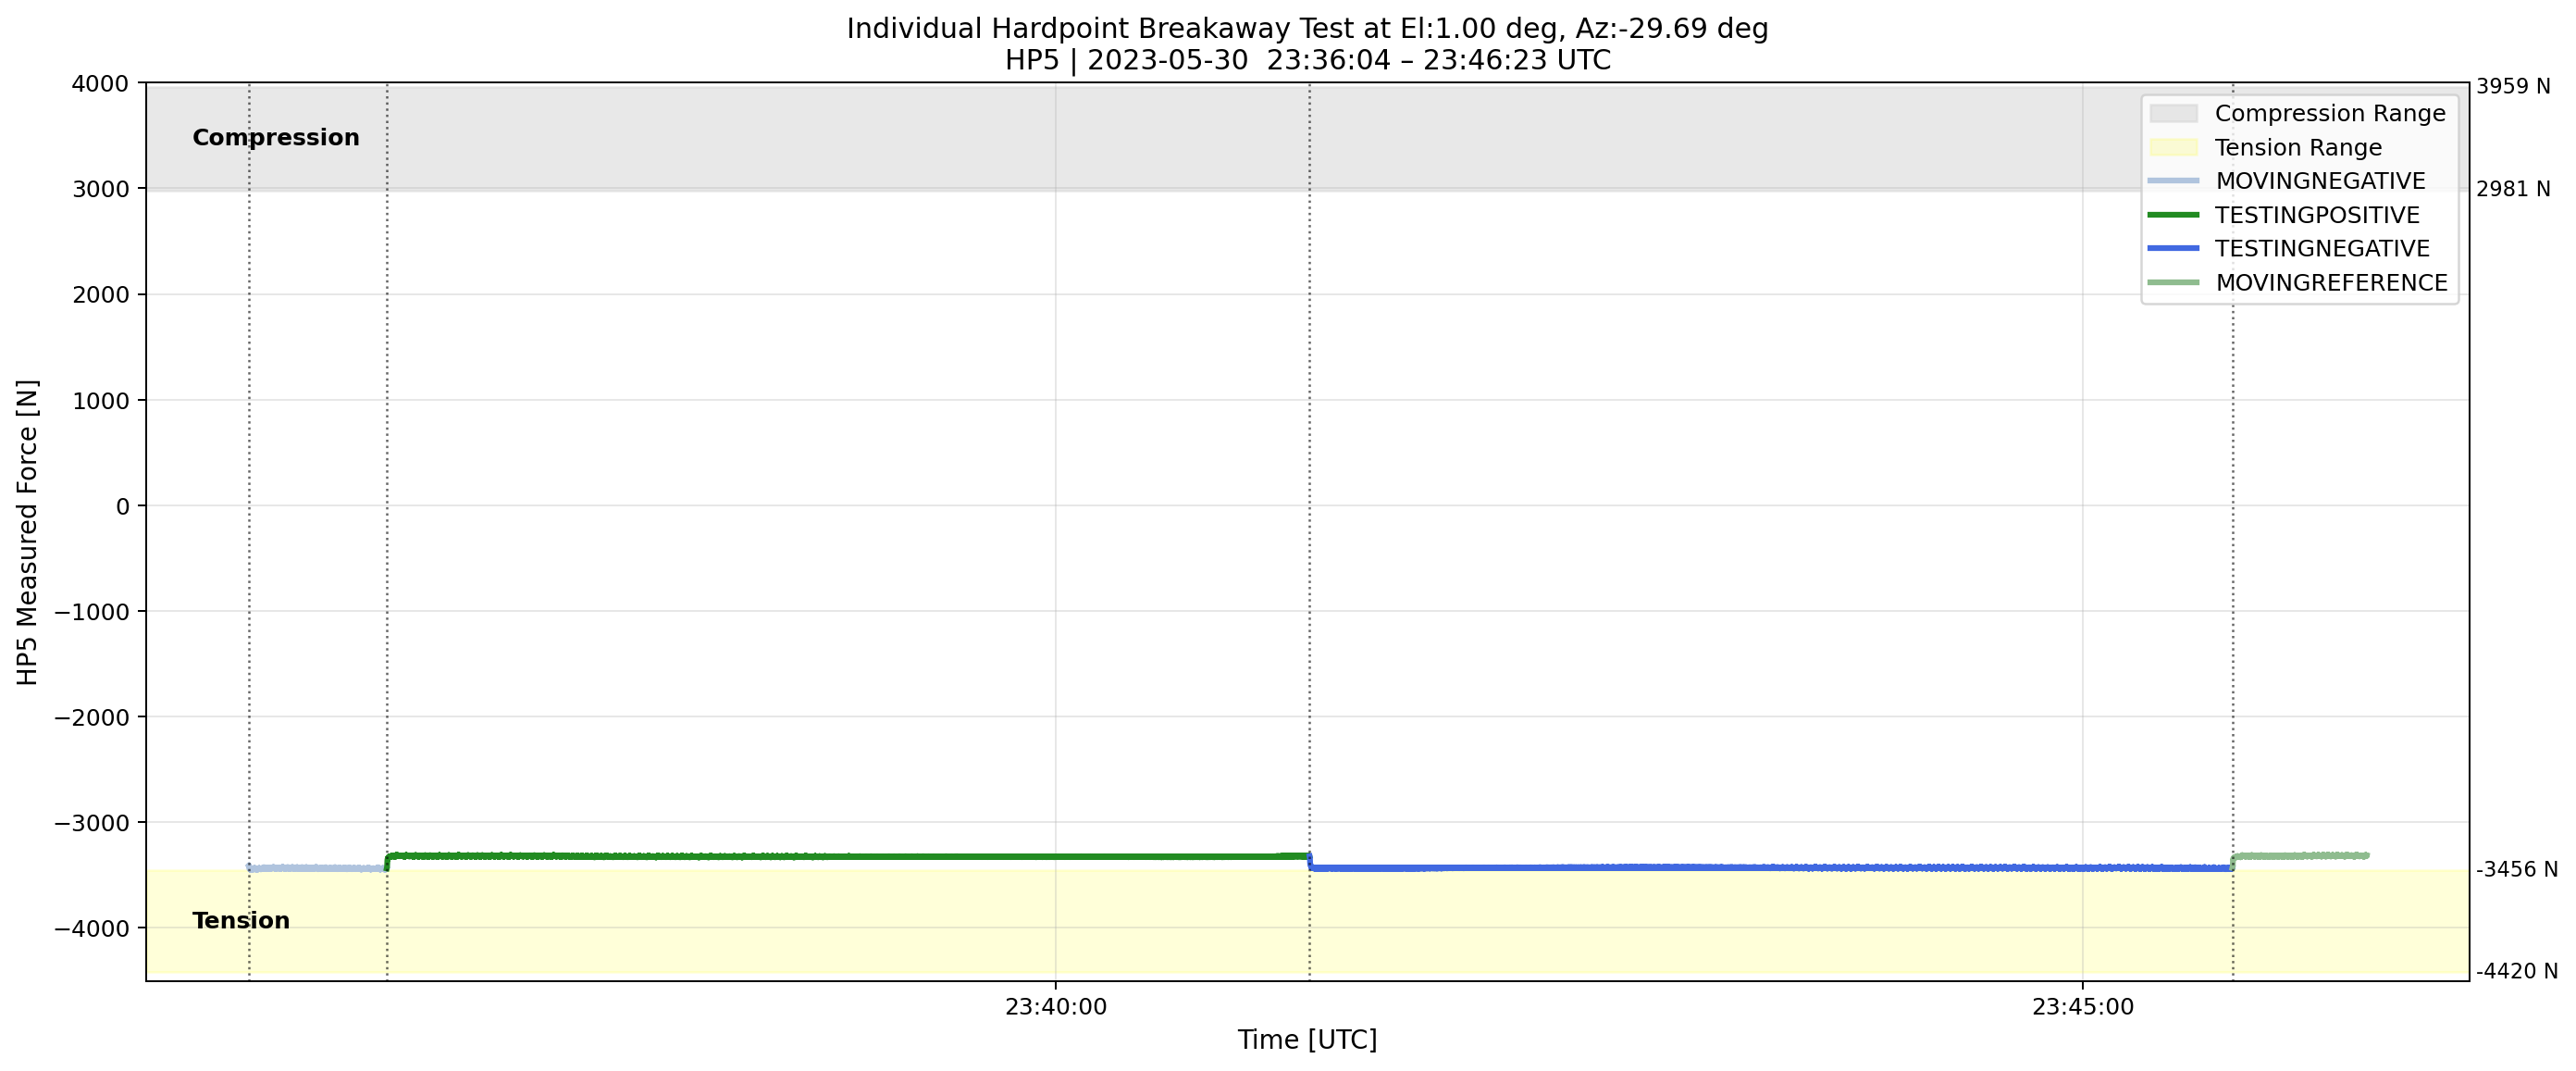
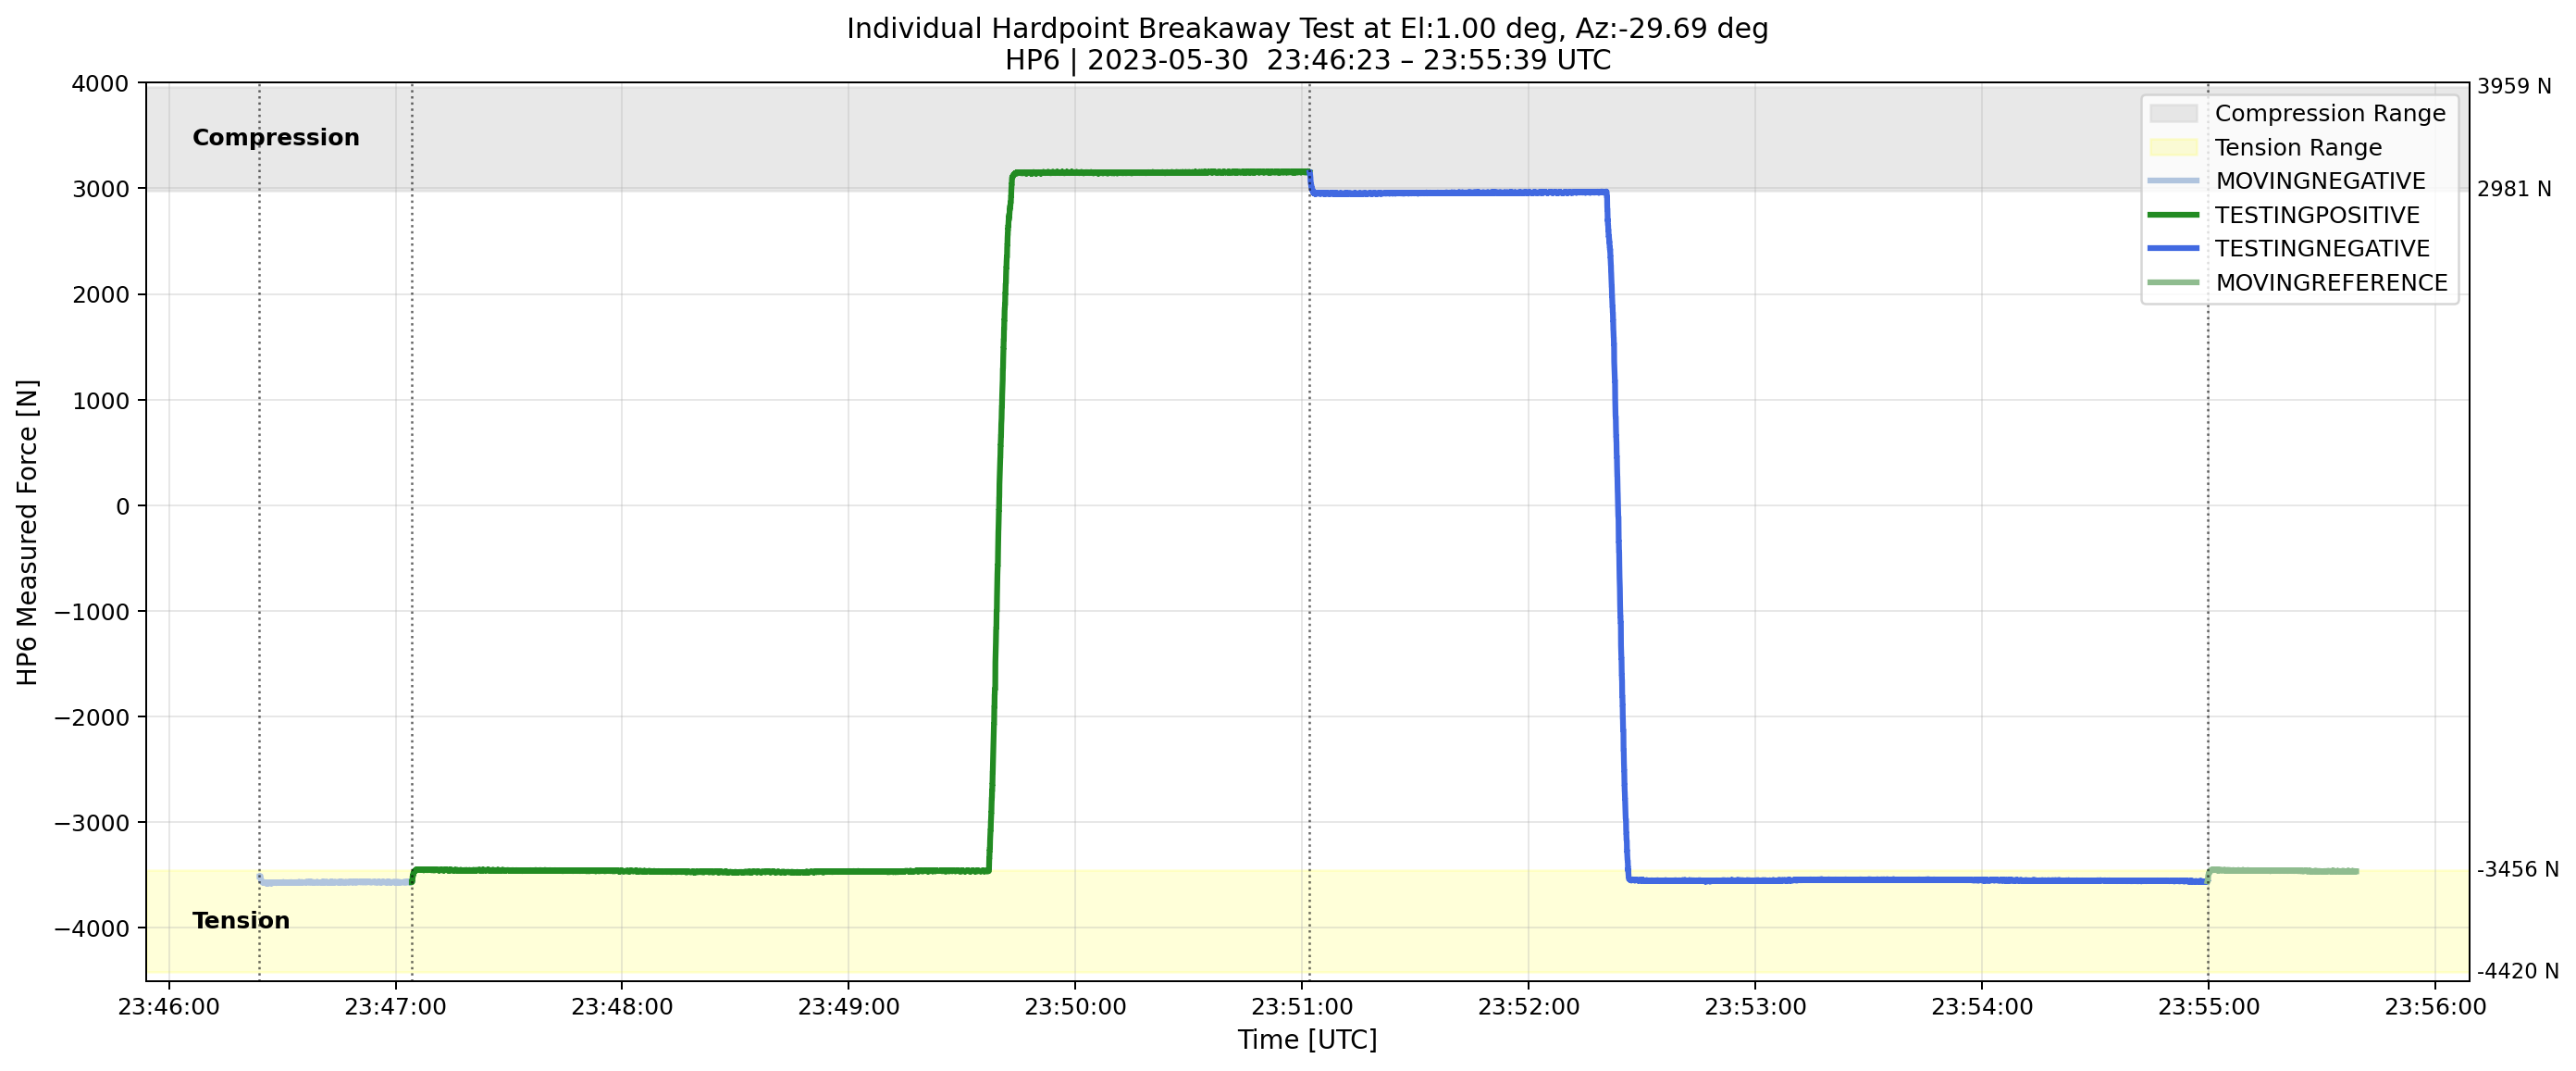
Fig. 18 Transition of the measured forces on each hardpoint when the TMA is at el=1deg.#
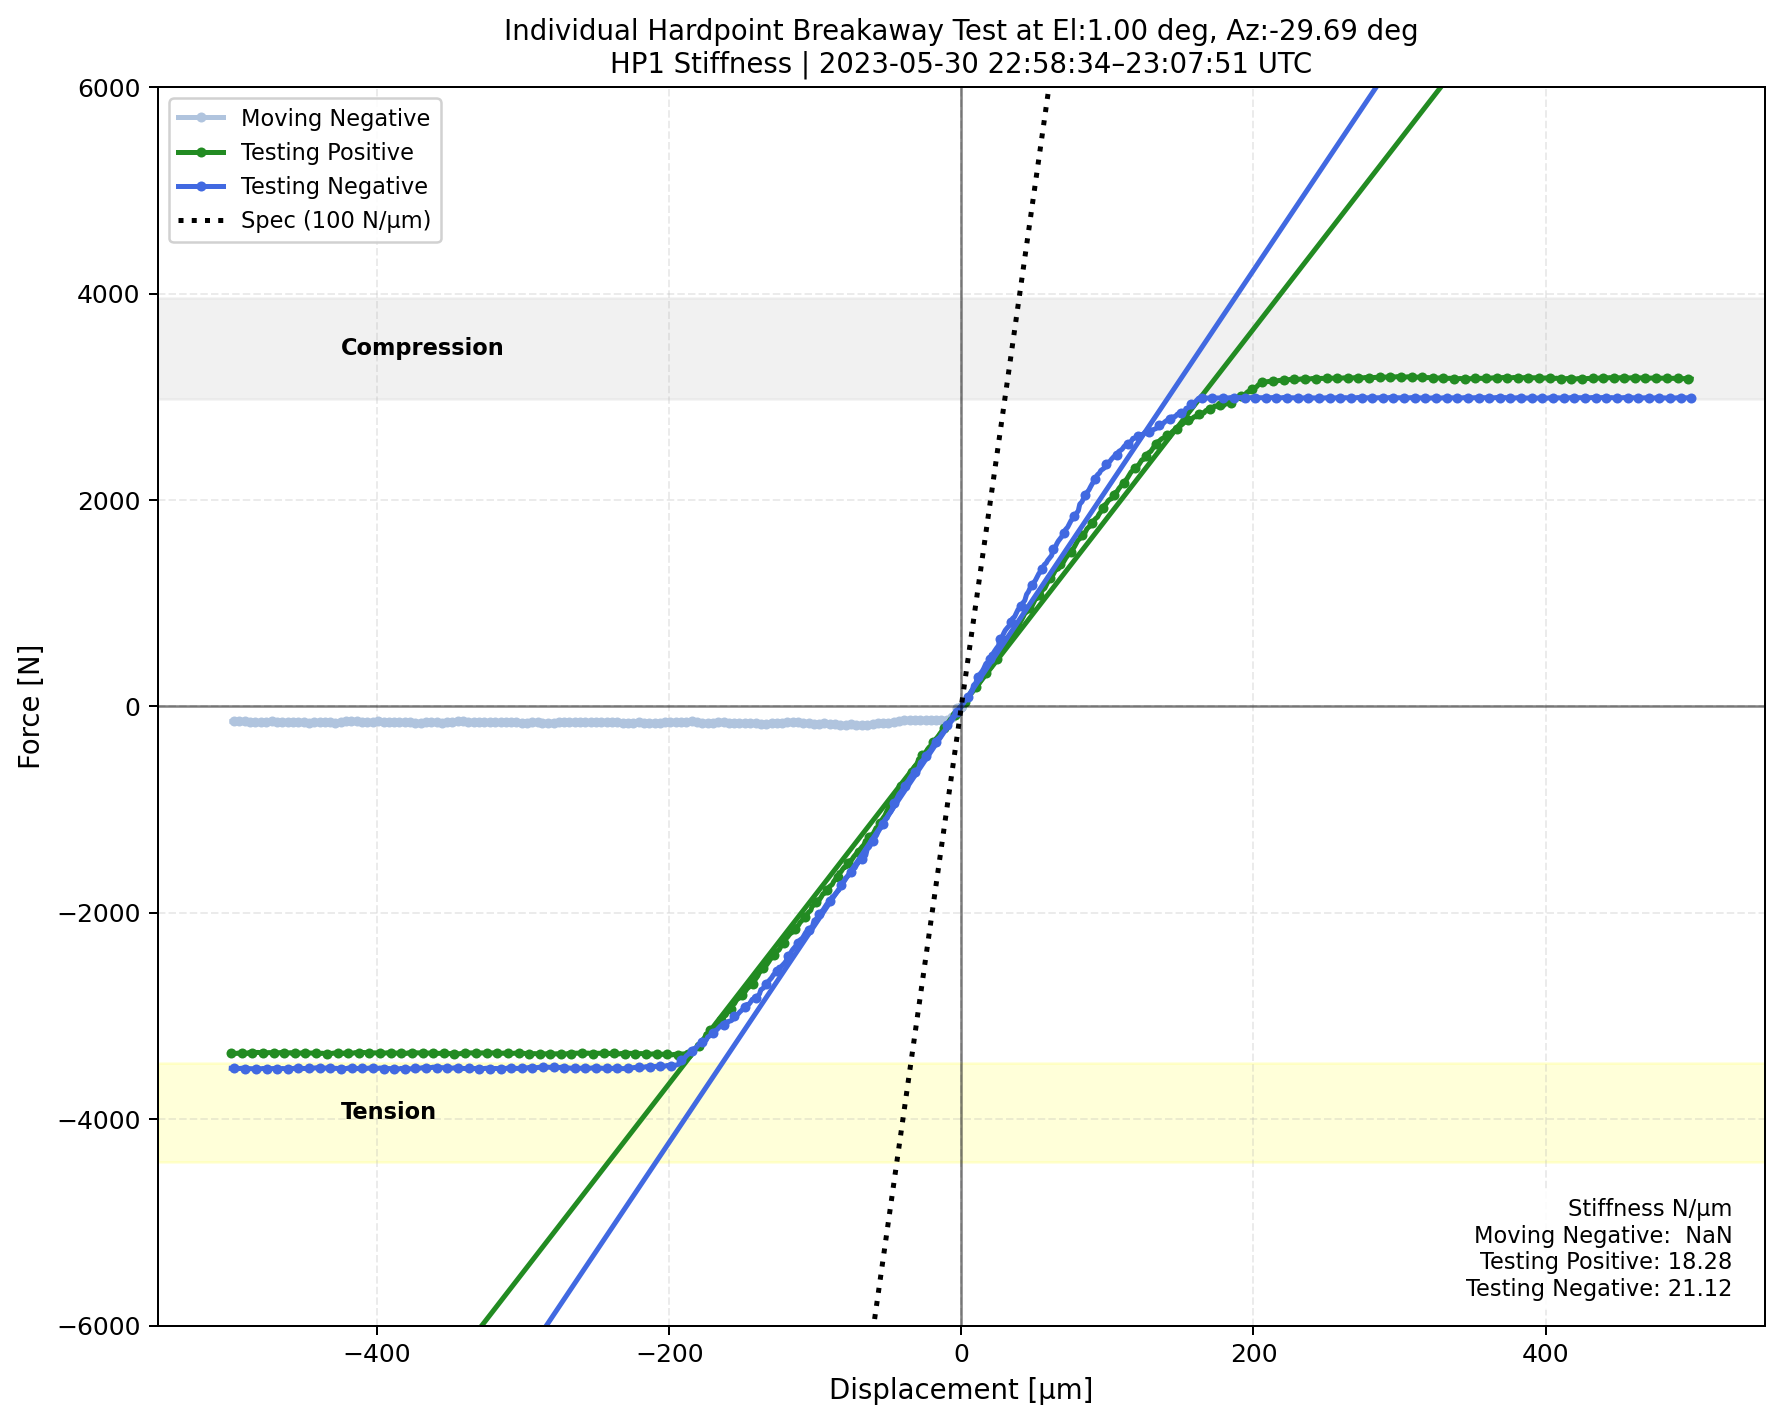
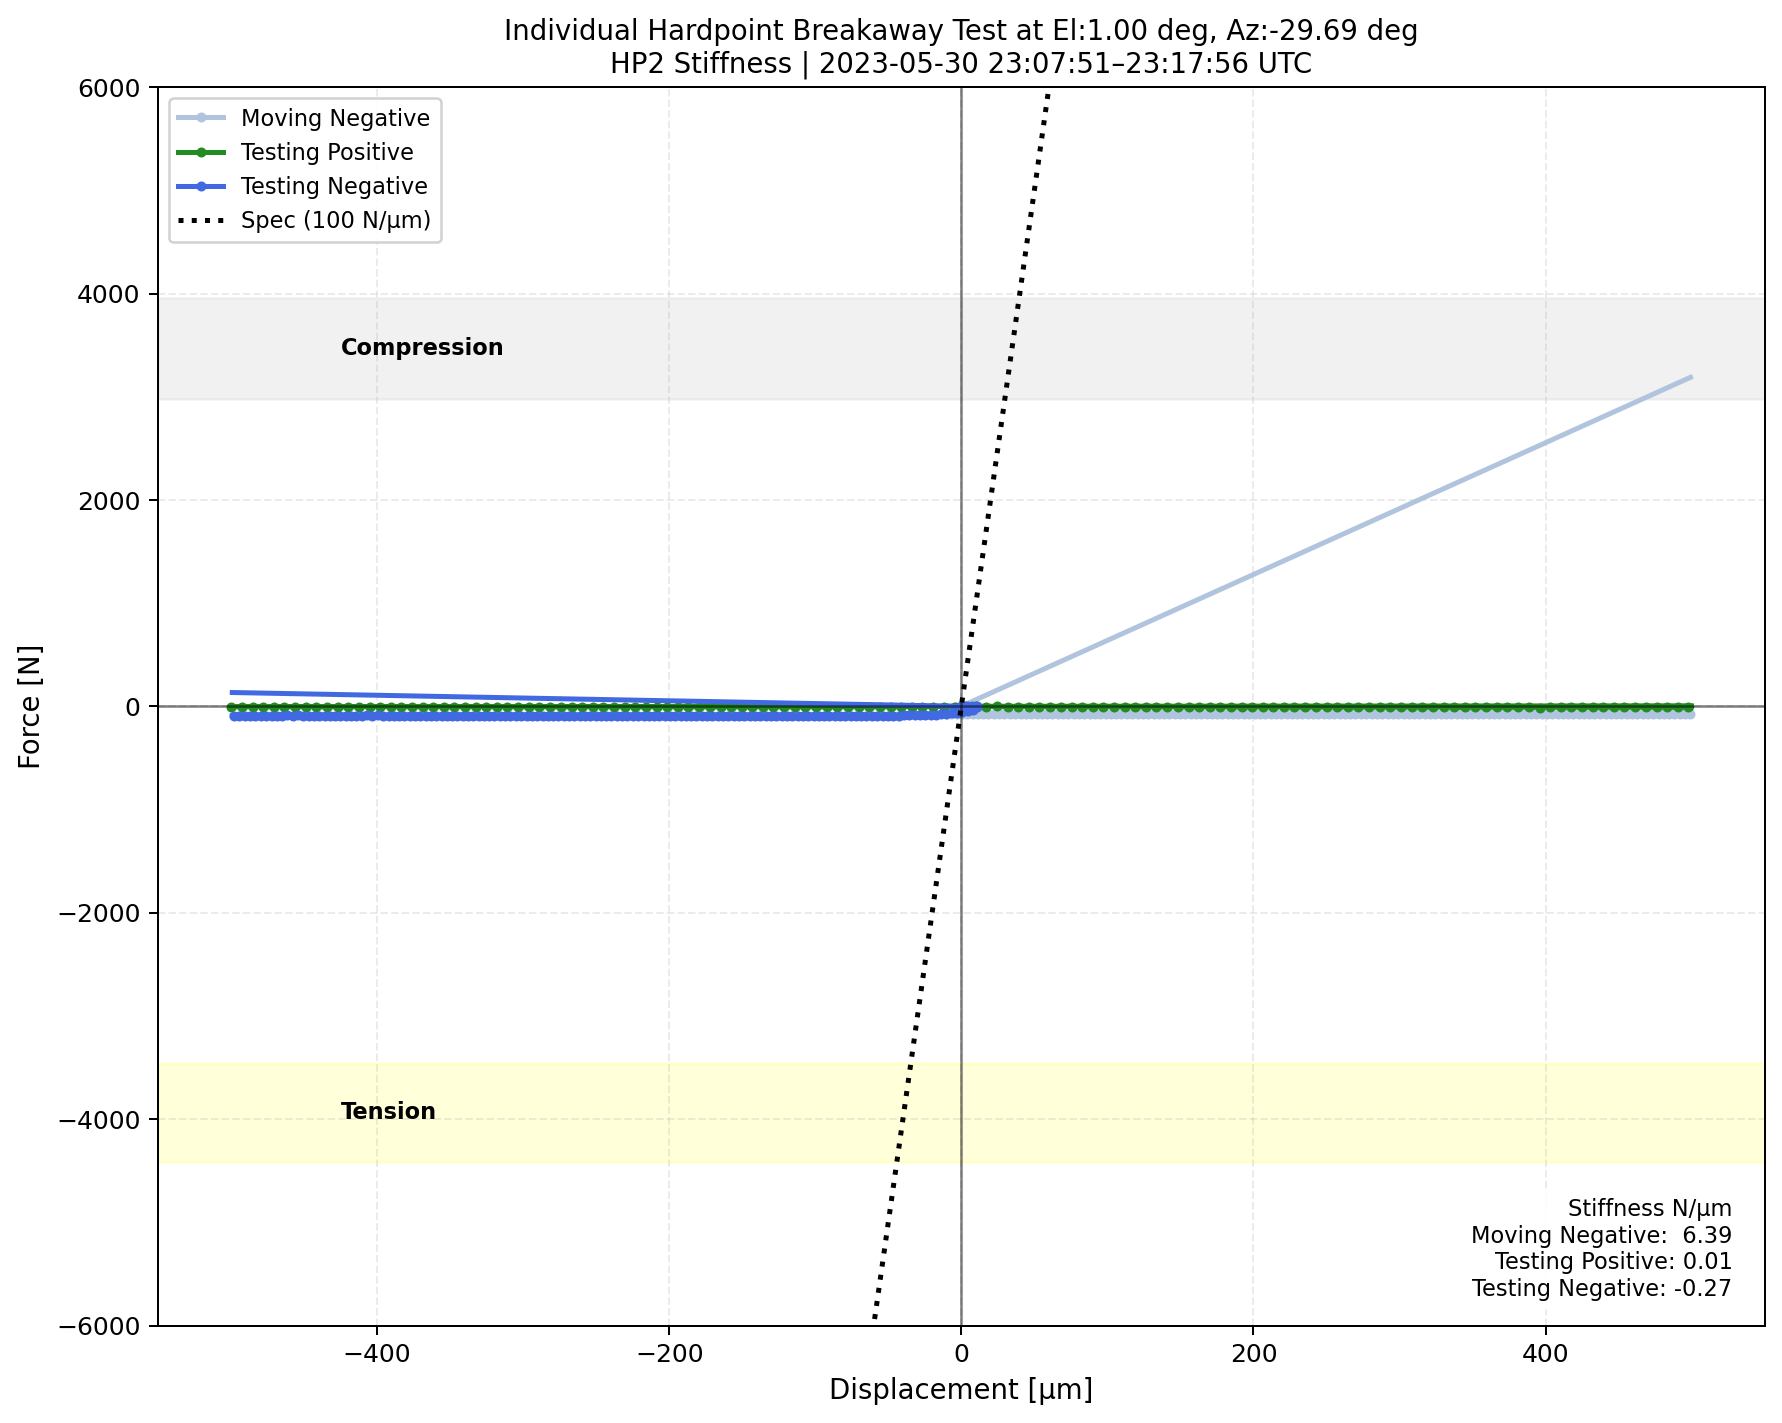


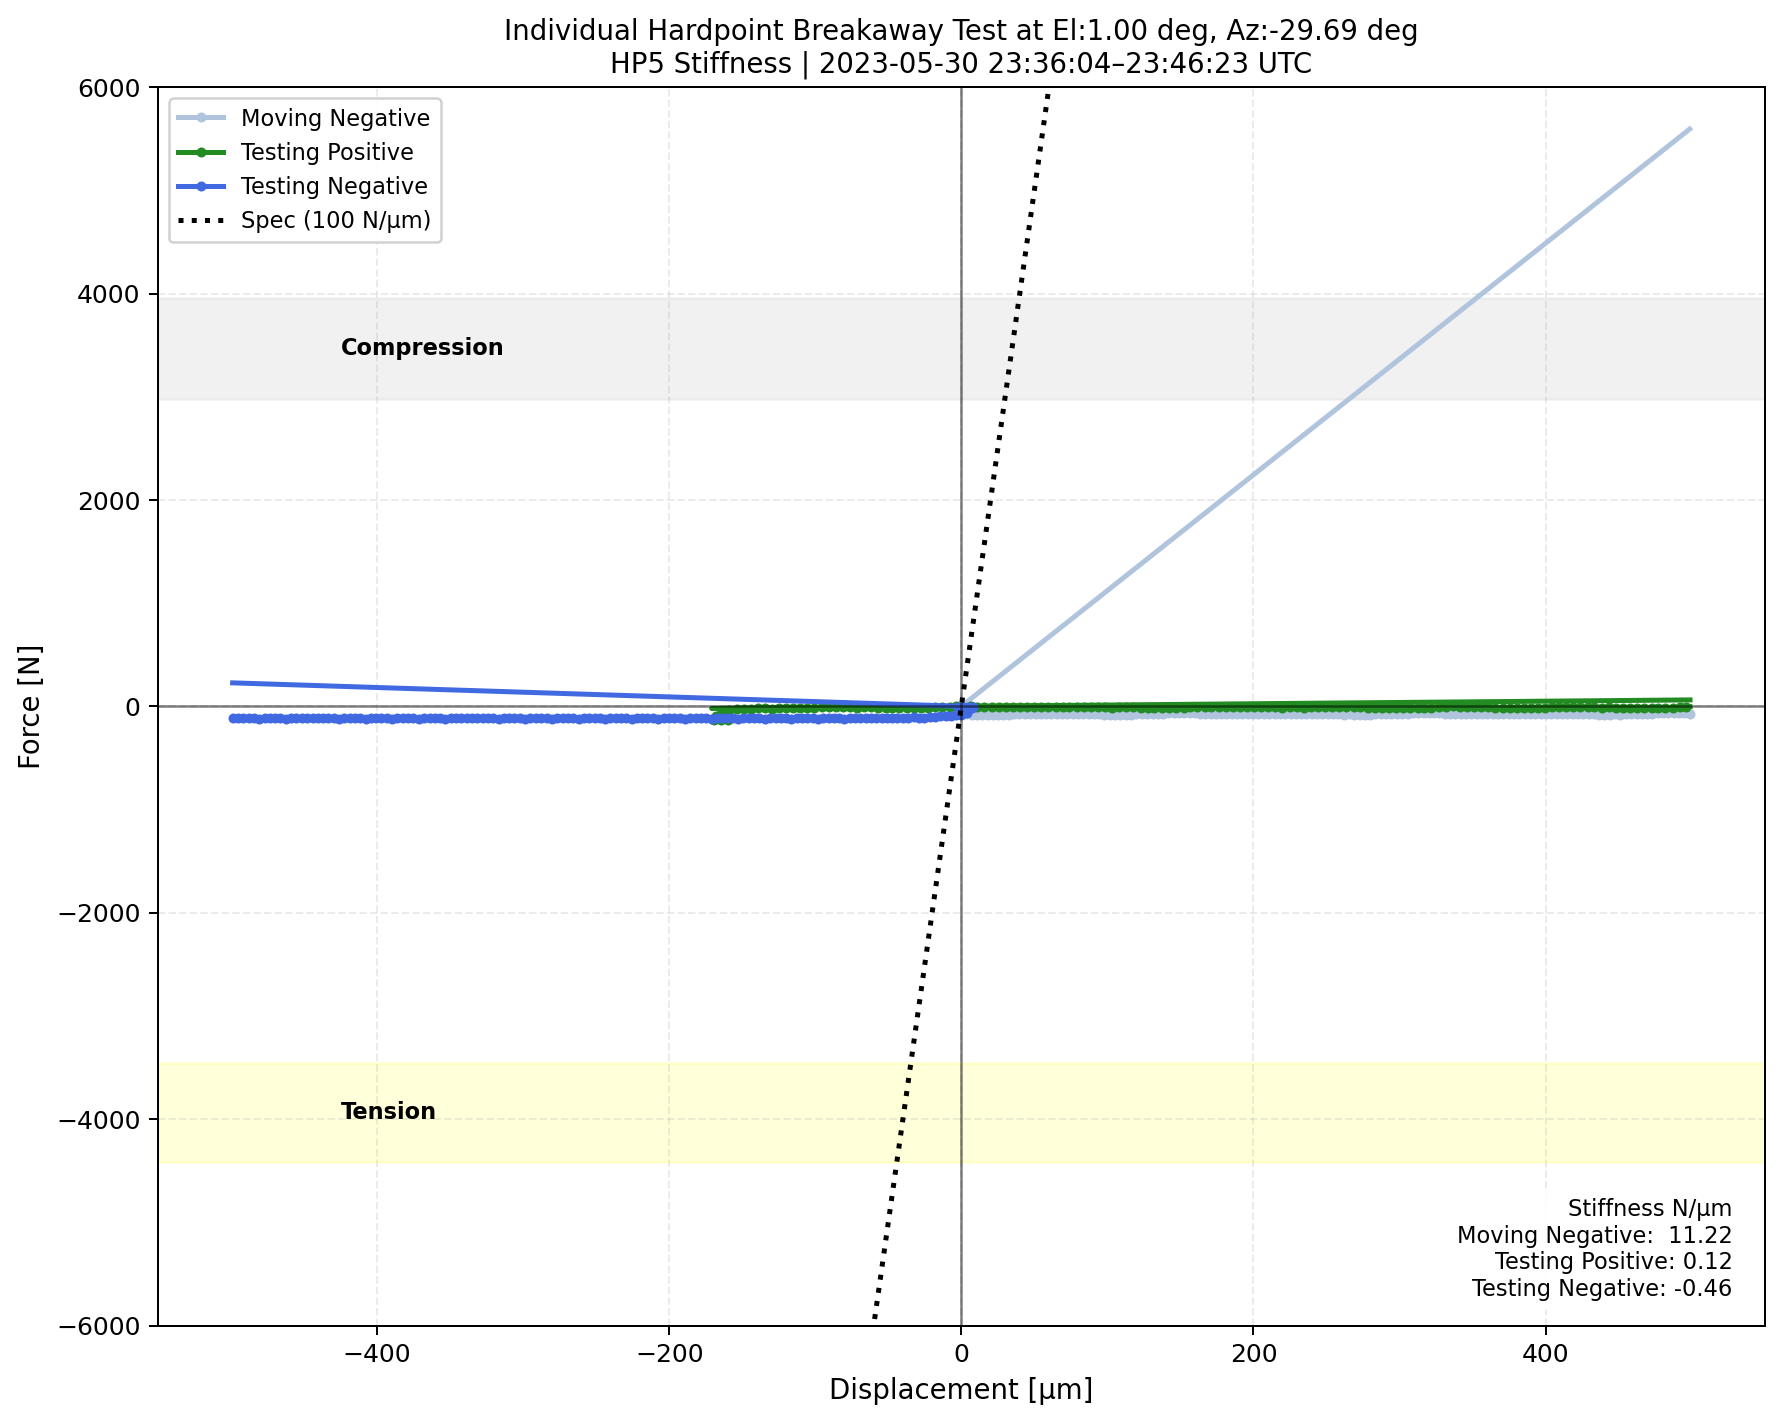
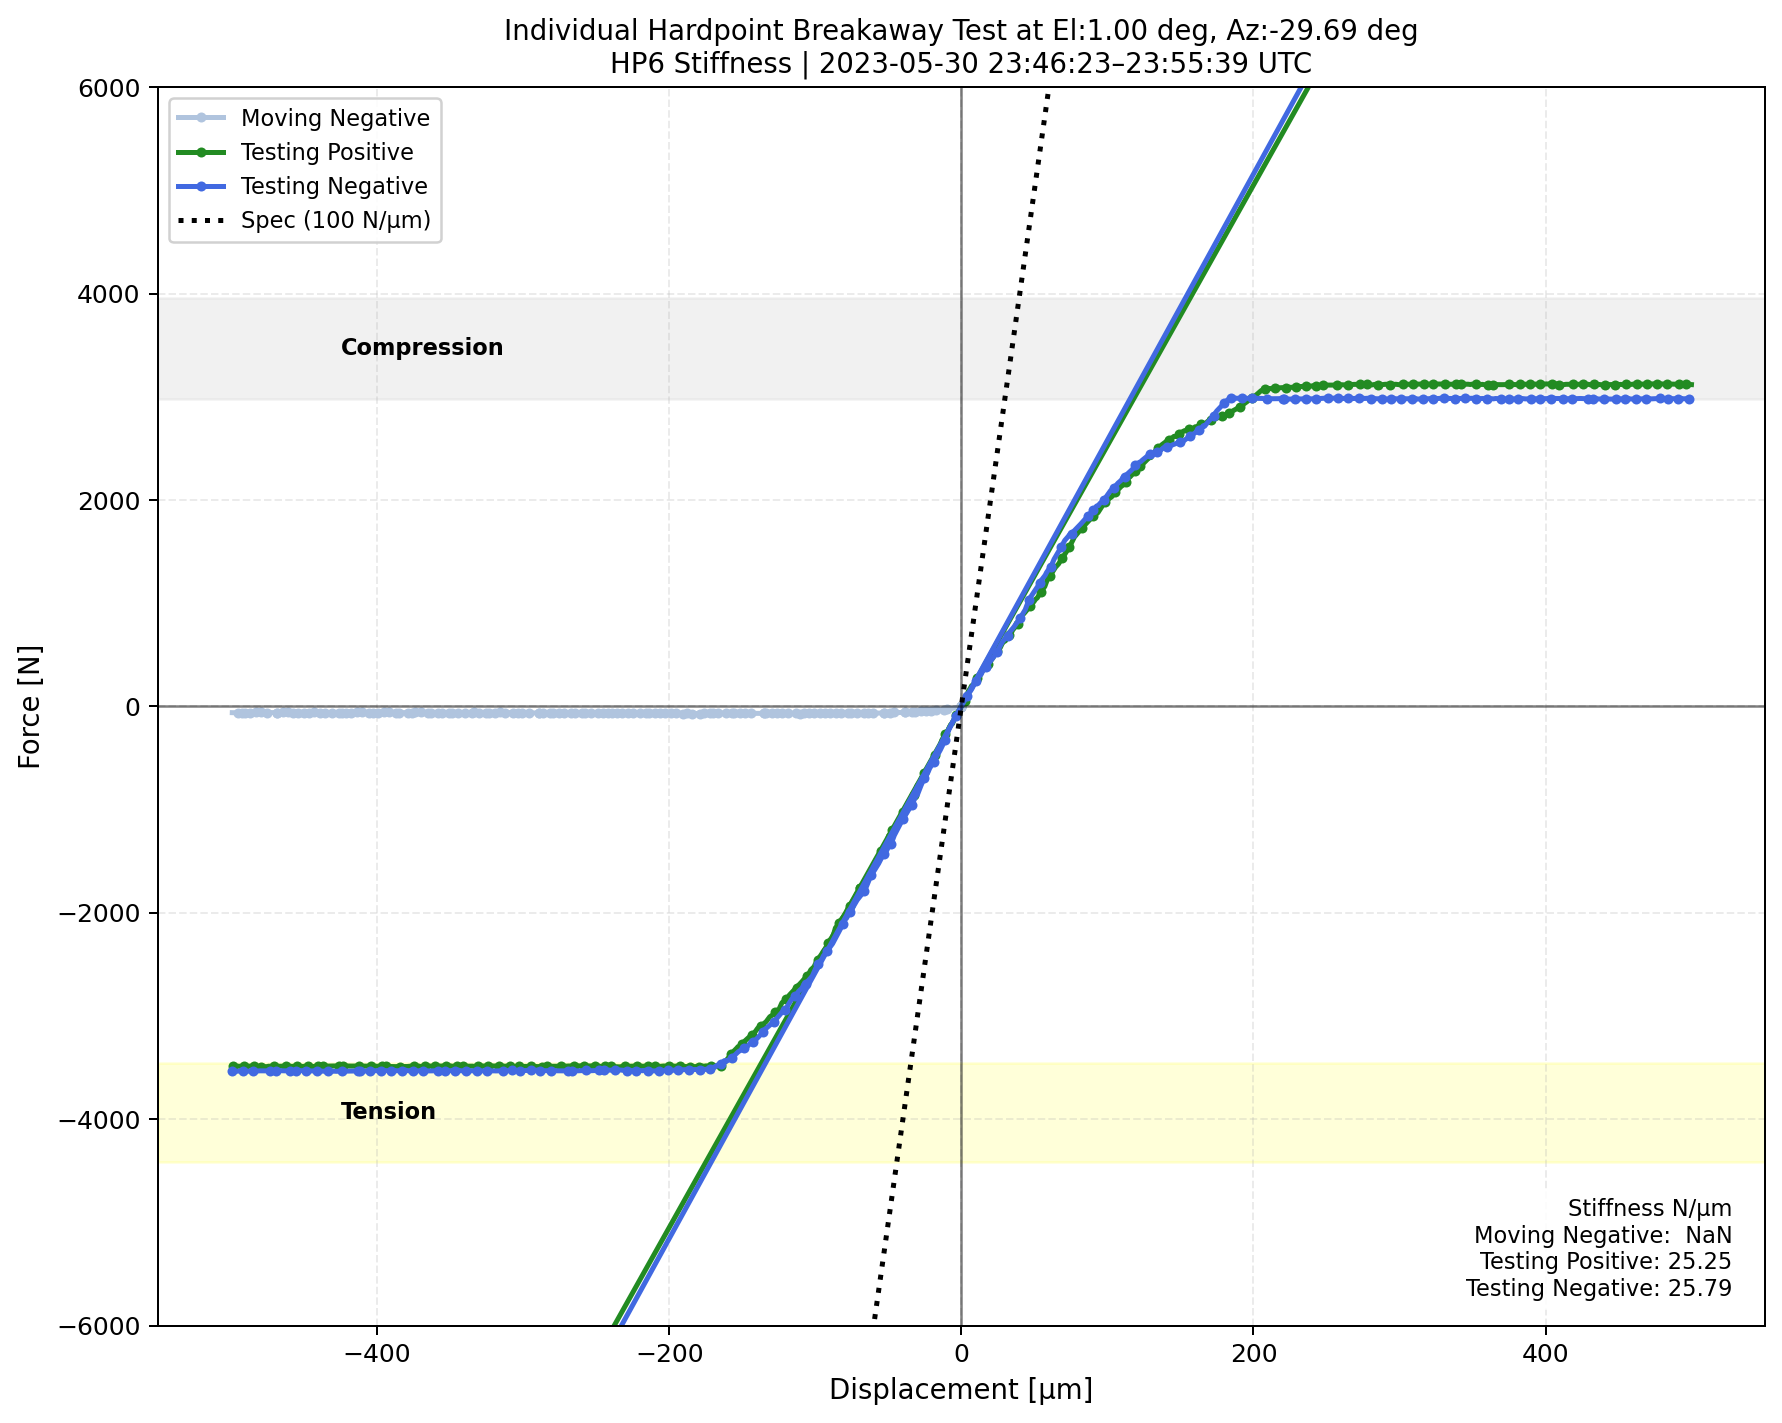
Fig. 19 <math>\Delta</math>Displacement versus measured forces for each phase during the hardpoint breakaway test when the TMA is at el=1 deg.#
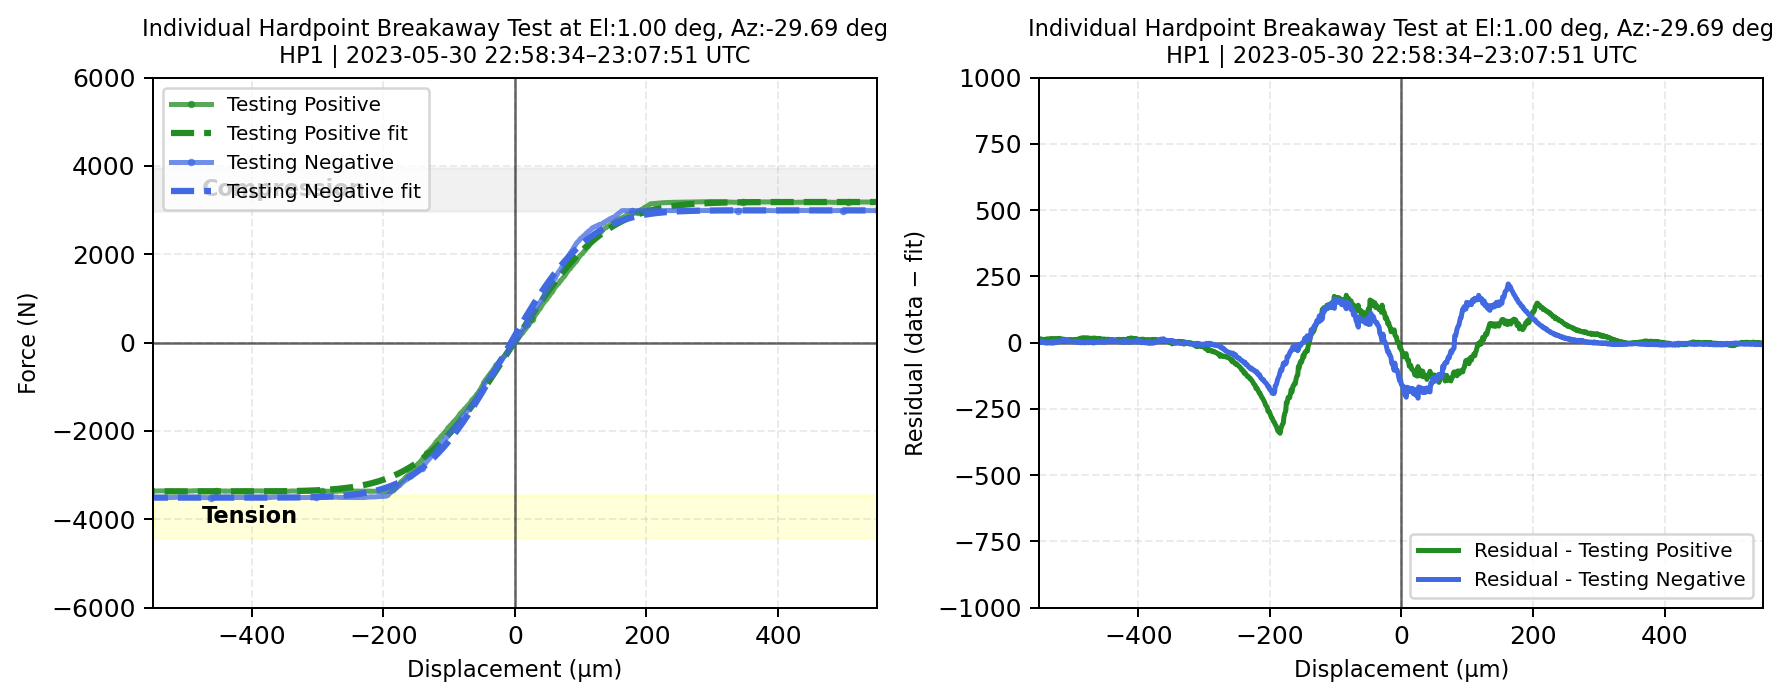


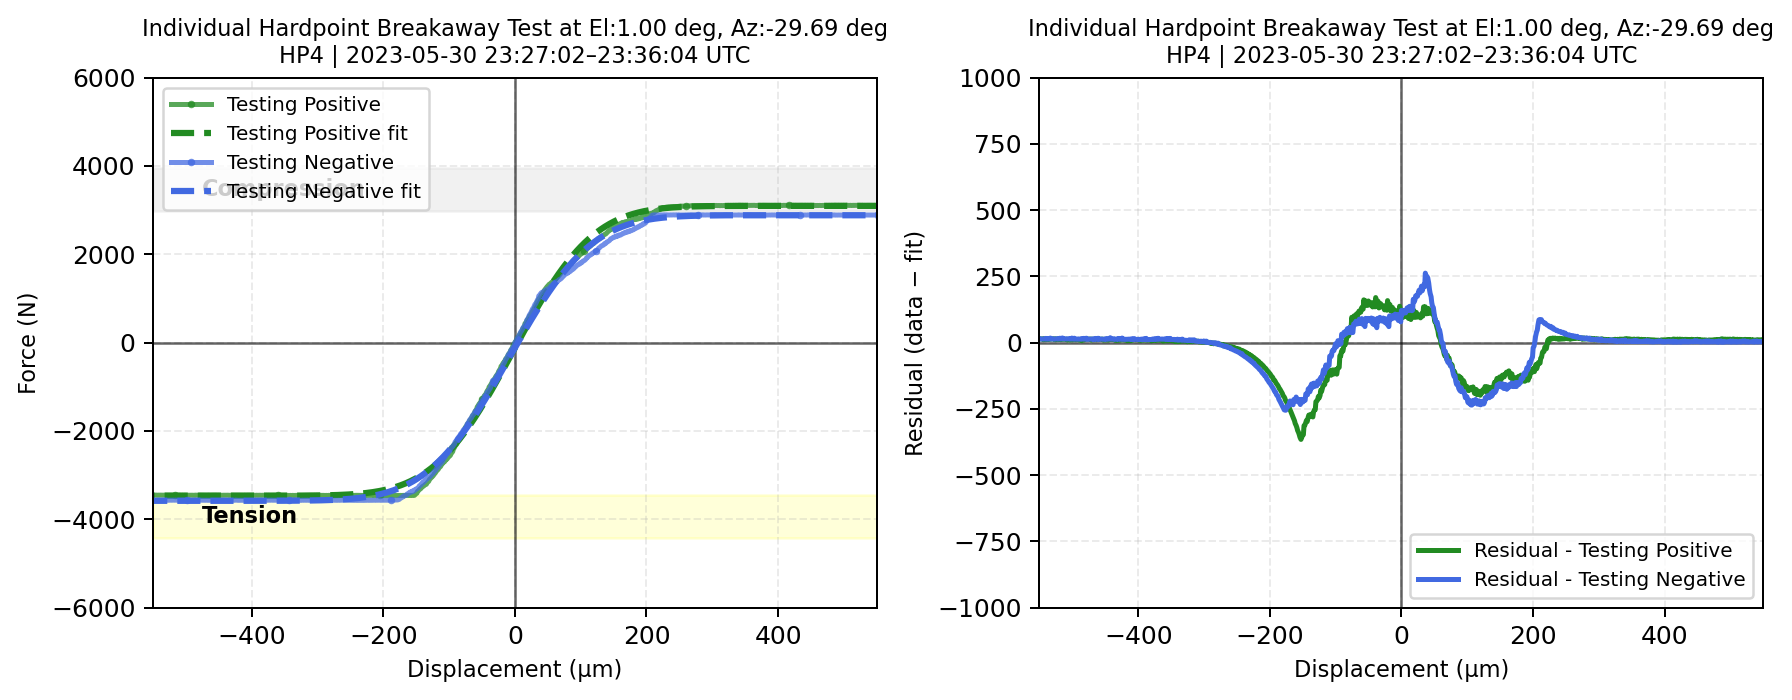
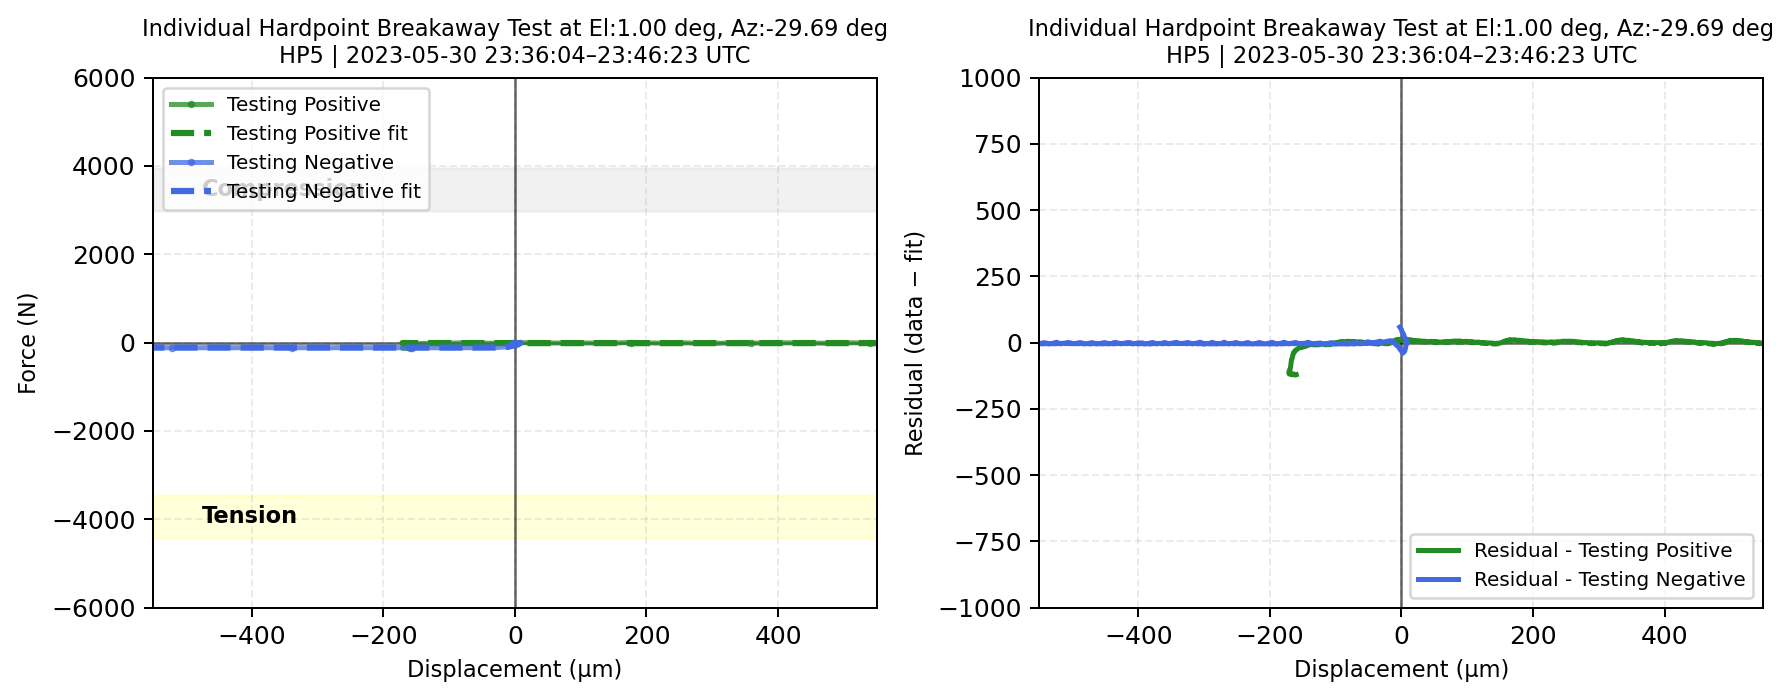

Fig. 20 (Left) \(\Delta\)Displacement versus measured forces for each phase during the hardpoint breakaway test fit with error function (the TMA at el=1deg). (Right) The residual, a difference between data and error function, with respect to \(\Delta\)displacement#
Historical Trending#
The previous figures for each hardpoint at different test days show, for example, that lower elevation angles tend to be associated with higher stiffness values. The relationship between stiffness and other parameters may help identify patterns that could reduce the risk of operational issues, which gives us clues about the importance to study the behavior of each hardpoint over time.
Therefore, in this section, we analyze the historical trends of the hardpoint breakaway tests using data from completed tests between 2023 and the present day.
Note
Each month has a different number of testing days.
Some days have no tests, while others have more than one test.
In order to view graphically the above we plot a dashboard to compare the data obtain for each day with completed test.
Dashboard 1. (Top) Interactive dashboard of test days. (Bottom) Interactive dashboard of hardpoint stiffness trends since 2023.
In the dashboard, the top plot shows the days with completed tests up to the present day. The y-axis represents the number of tests performed on each day. From this, we observe that in may 2023 had the highest number of tests conducted in a single day.
On the other hand, the bottom plot shows how the daily mean stiffness evolves over time, modeled by Hardpoint (HP) and state. In general, we observe that stiffness values tend to become more linear over time.
The following dashboard clearly illustrates the dependence of stiffness on the elevation angle for each HP. For this analysis, we considered only physical stiffness values. To apply the normal fit, only angle ranges that met the minimum sample size requirement (n≥10) were considered. Consequently, angles such as 45°–50° for HP2 (testing positive state), which has only 3 data points (n=3), were excluded as they do not provide enough information to obtain statistically significant results.
Dashboard 2. Interactive dashboard illustrating how stiffness distribution varies in relation to angle range, categorized by state and hardpoint (HP).
Furthermore, for elevation angles up to 70 degrees, there are insufficient data points for each HP to calculate the median or standar deviation via normal fit, given our minimum requirement of n≥10.
In contrast, for angles above 70°, we observe that HP1 reaches a minimum mean stiffness of 15.02 N/µm in the 80°–85° range (\(\sigma\)=2.38), while HP6 reaches a maximum of 31.03 N/µm in the 85°–90° range (\(\sigma\)=1.78). Overall, a general trend is observed: for each hardpoint, an increase in elevation angle correlates with a decrease in stiffness values.
Regarding the breakaway analysis, we obtained the breakaway force (N) and displacement (µm) for each HP and state. The following figure illustrates the distribution of these values: points in the positive testing state are located within the tension band, while points in the negative testing state are situated within the compression band.
The crosses represent data points that, for various reasons, fell outside these bands and were classified as outliers. The plots indicate that the positive testing state (tension) exhibits a higher frequency of outliers compared to the negative testing state (compression).
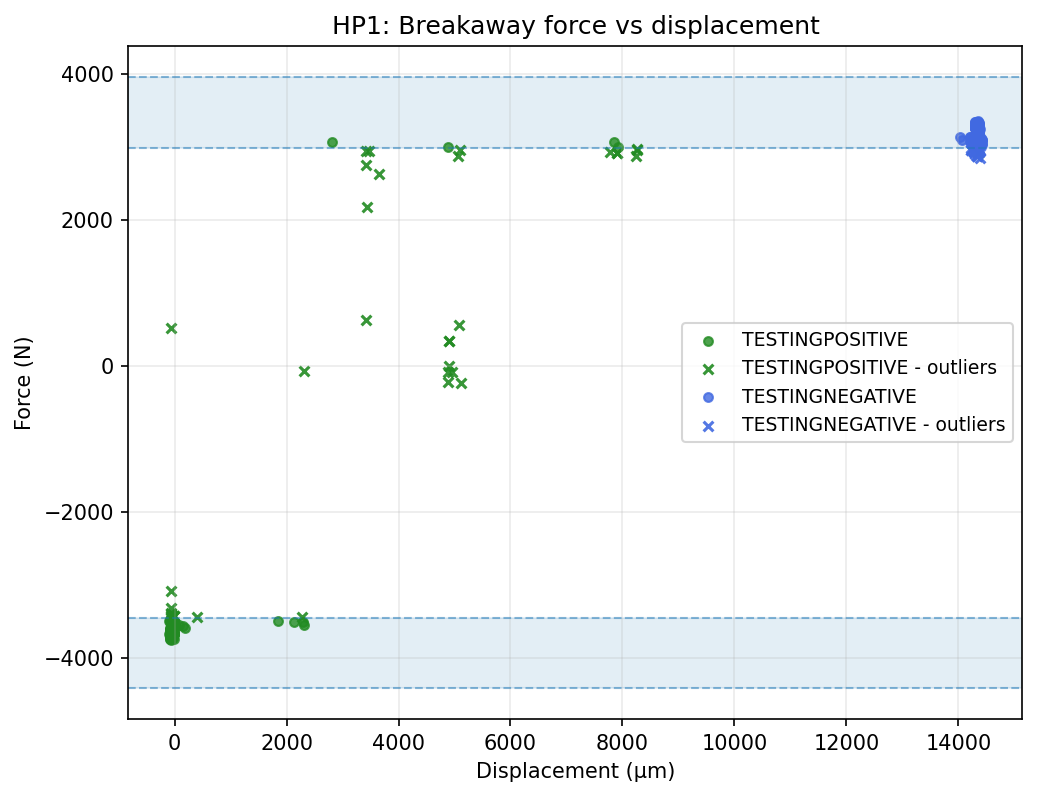
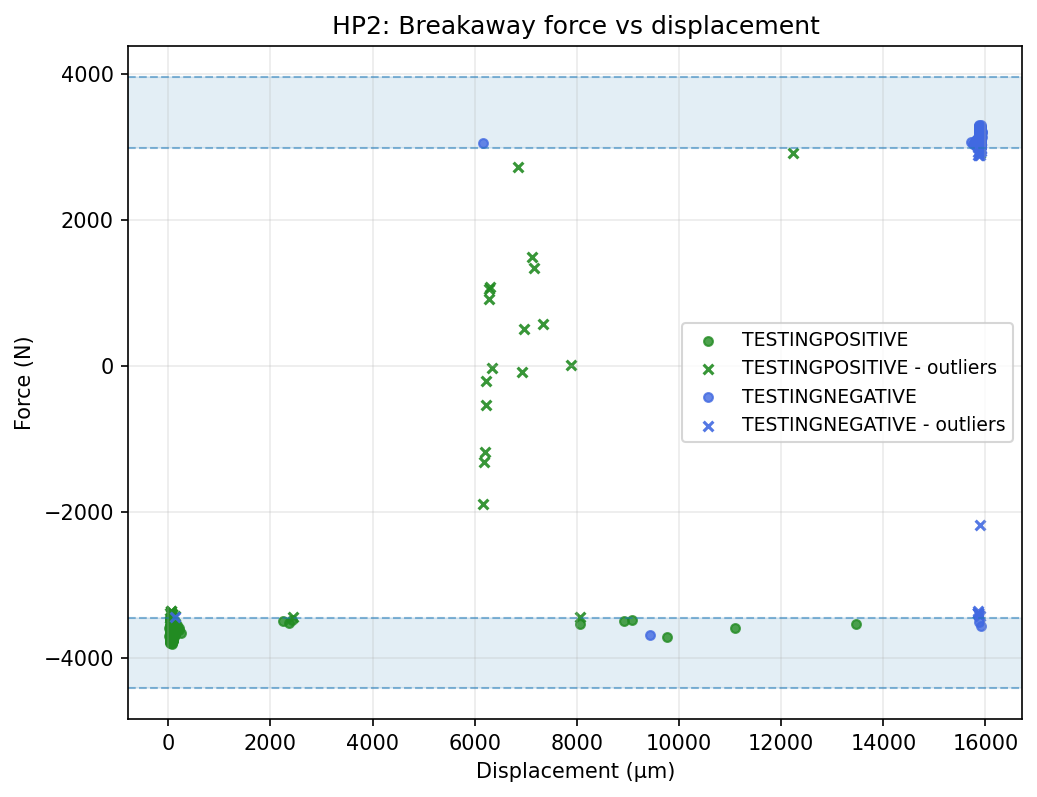
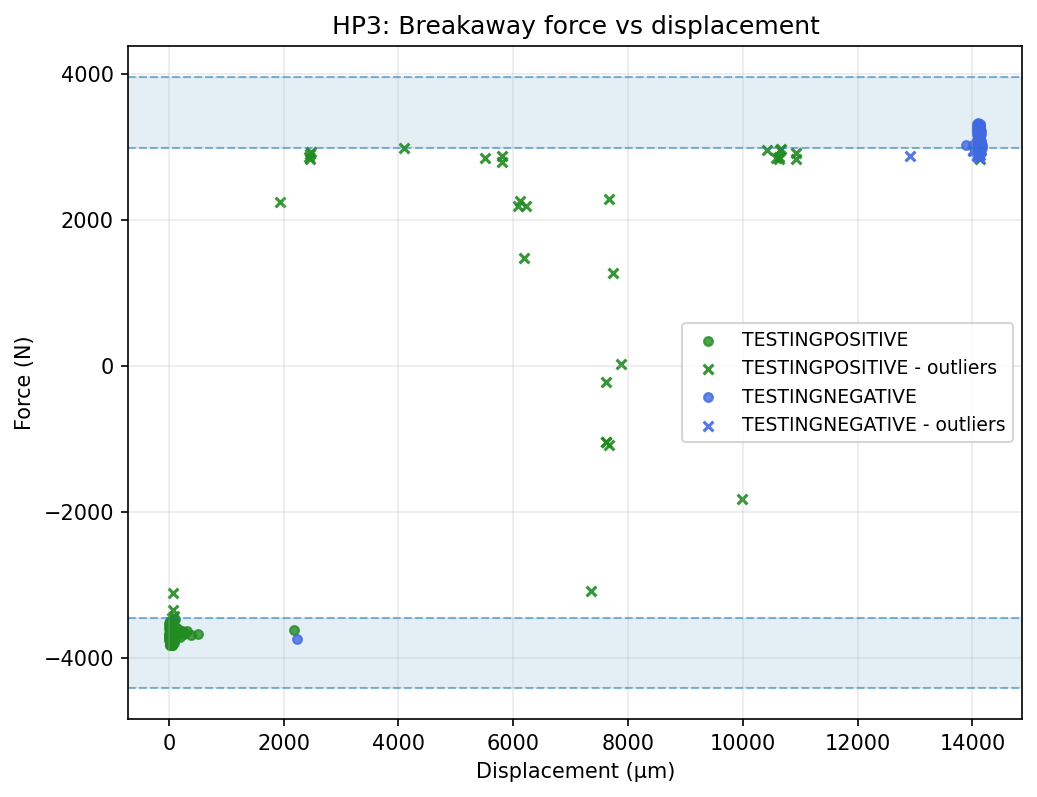
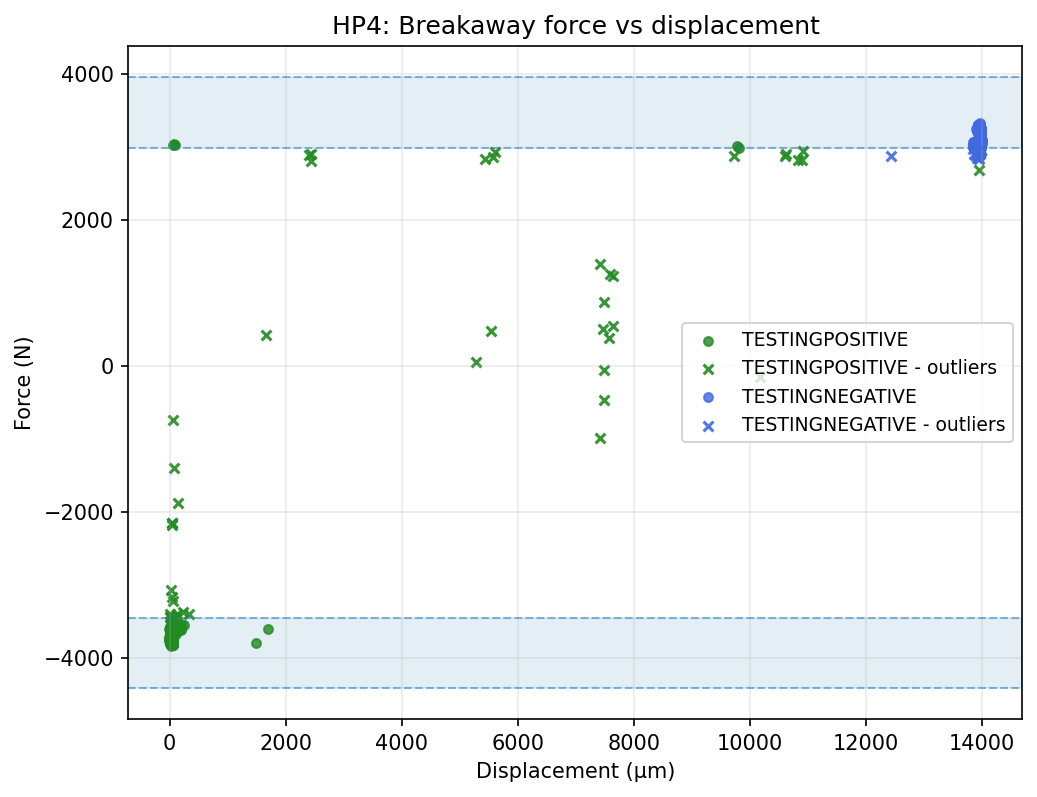
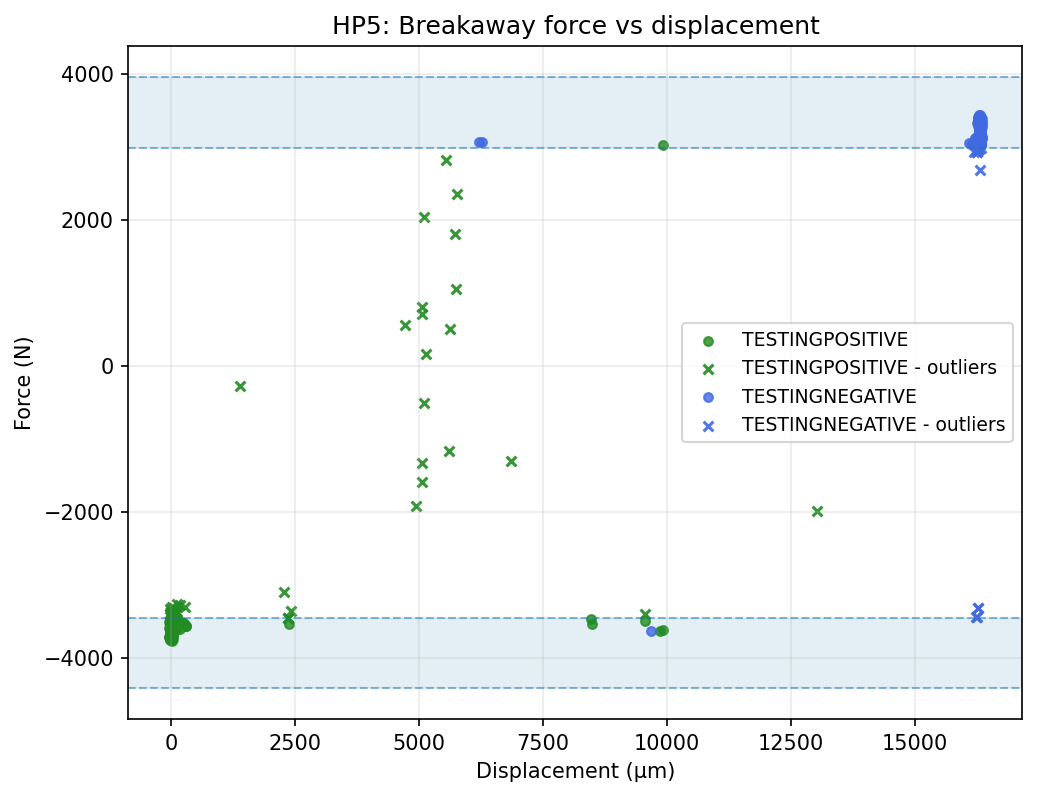
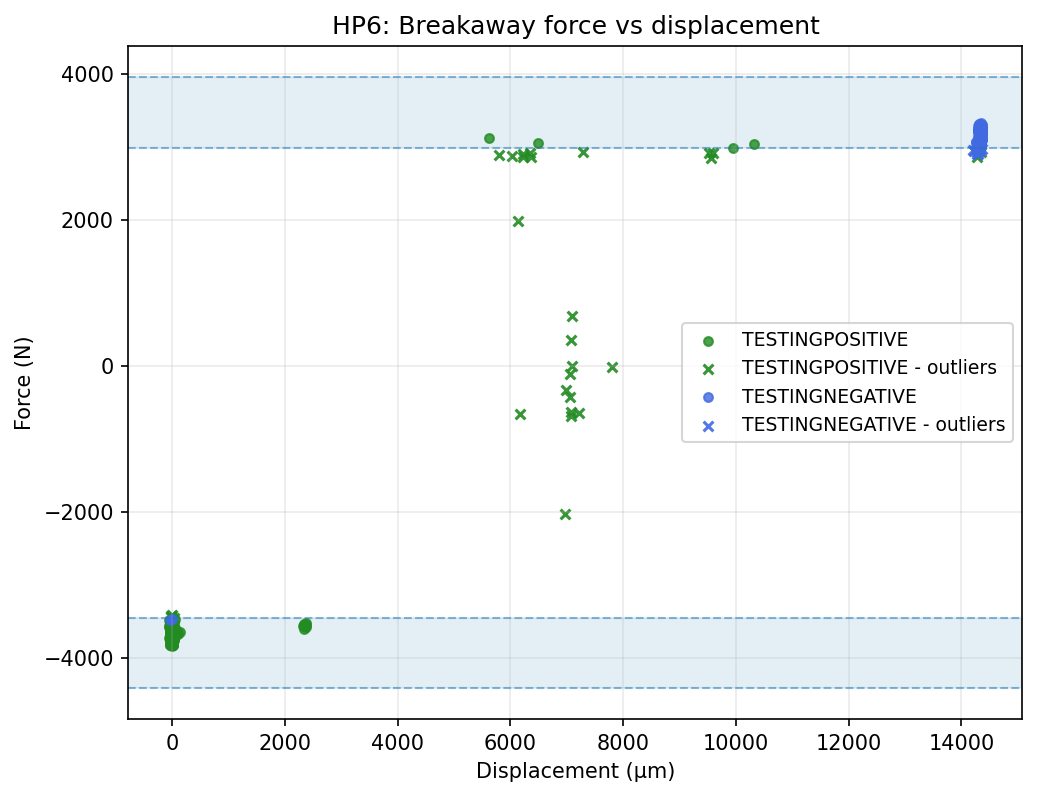
Fig. 21 Plots breakaway force vs breakaway displacement for each hardpoint. The blue circles represent the points on state testing positive that are located in the tension band and the blue crosses are the points that we called outliers because are located between the compression and tension bands. The orange circles, instead, are the points on state testing negative located in the compression band, and the same way, the orange crosses are outliers in this state.#
Hardpoint Timeline#
Analyzing each hardpoint individually provides insights into their mechanical condition and therefore the safety of the M1M3 mirror. Hence another element to consider is the behavior of the hardpoints over time.
The dashboard reveals that the trend for each HP differs. We can observe that the period from 2023 to late 2024 was the most unstable, whereas the period from 2025 to the present shows a more linear behavior. Additionally, the heatmap indicates that HP2 exhibited lower stiffness at the end of 2023.
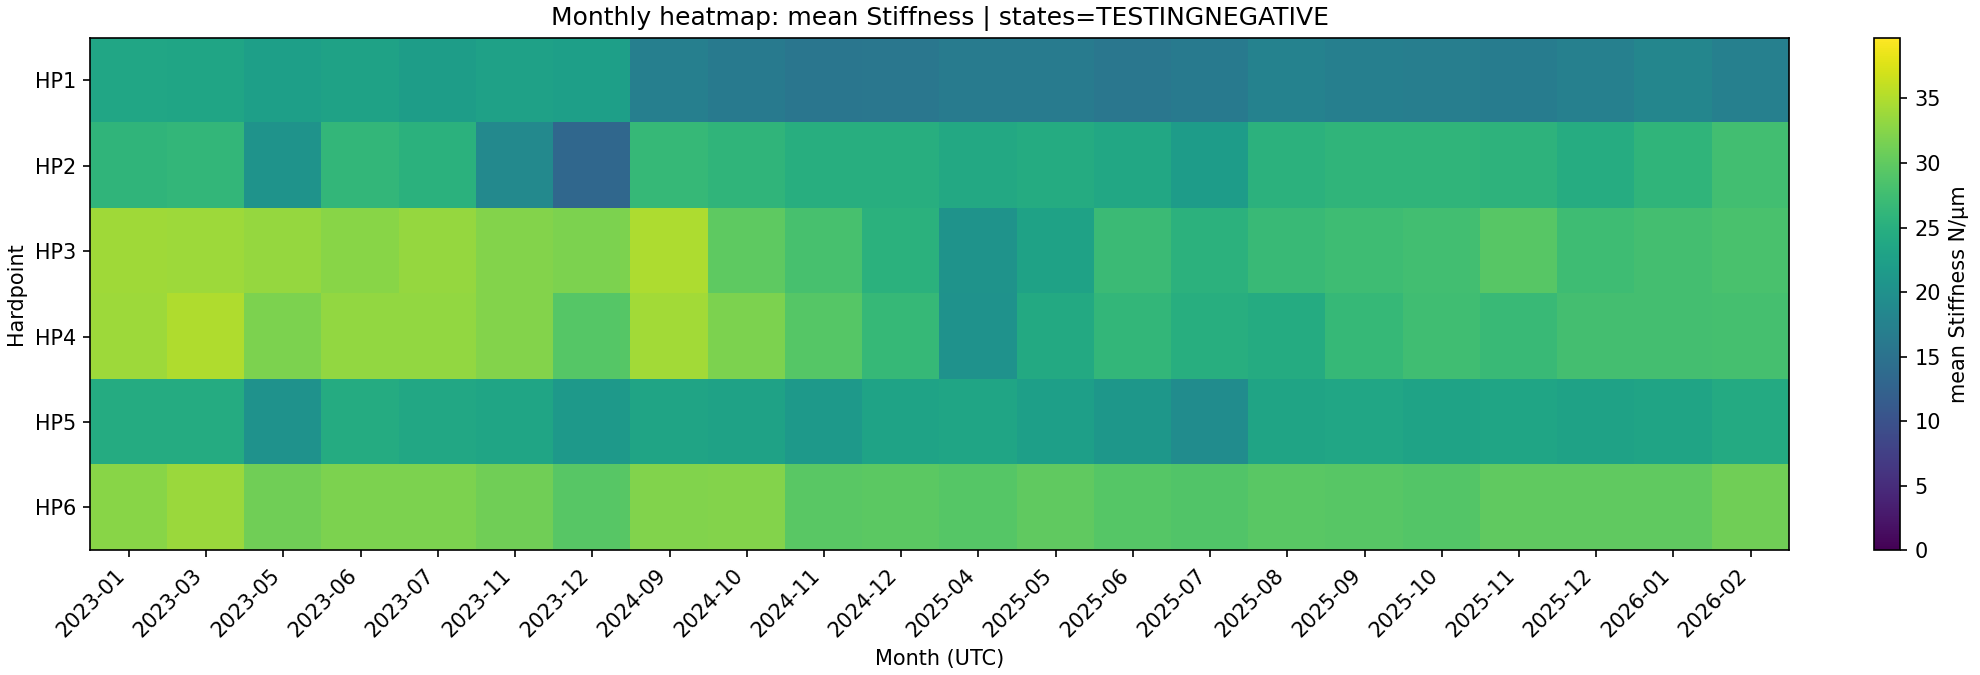
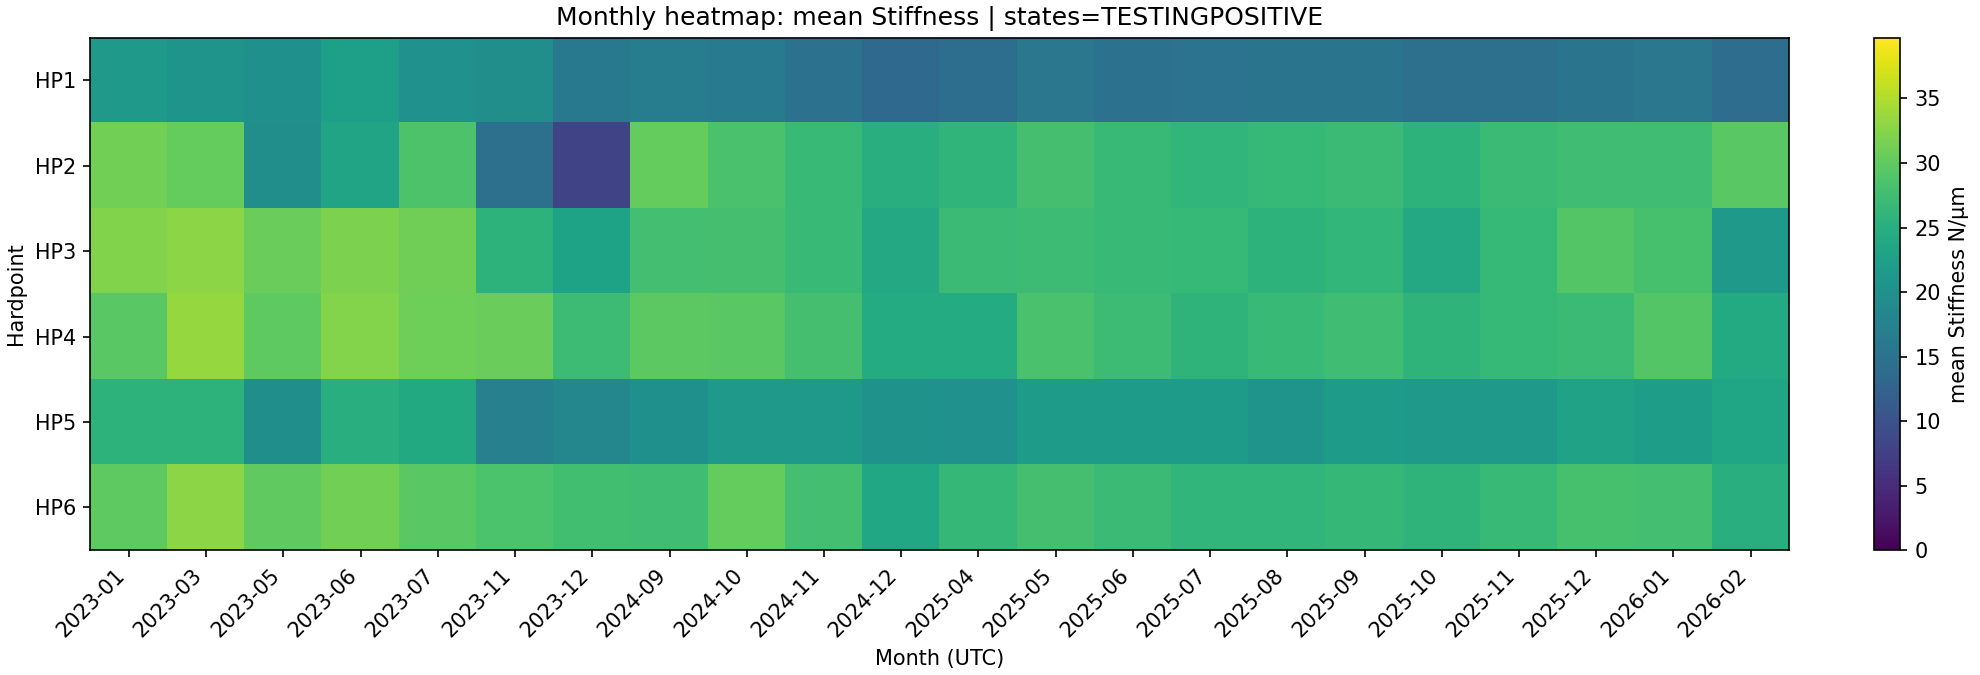
Fig. 22 (Top) Heatmap of monthly stiffness mean (negative/compression state). (Bottom) Heatmap of monthly stiffness mean (positive/tension state). Both plots show high stiffness values during 2023 and 2024.#
Based on these observations, a more robust analysis should prioritize data from 2025 onwards. In addition, three different filters were applied to exclude zeros, non-physical values, and days with incomplete states (i.e., days containing only ‘testing positive’ or ‘testing negative’ states). Consequently, 154 valid days have been retained since 2025.
The following plots illustrate how each HP changes depending on the testing state. Asymmetry between compression and tension is expected, as the piston sizes differ while the internal pressure remains equal.
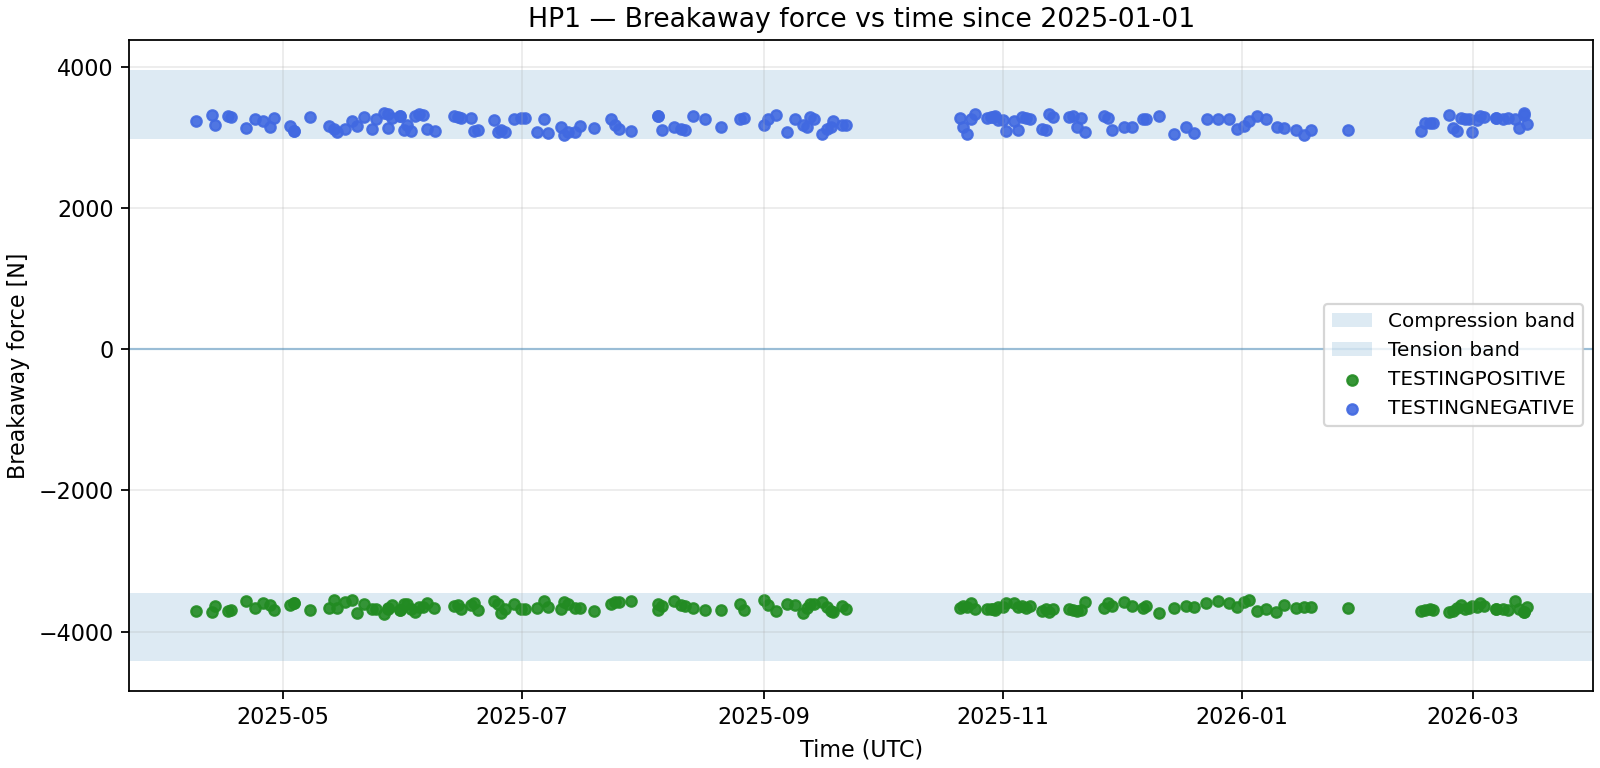
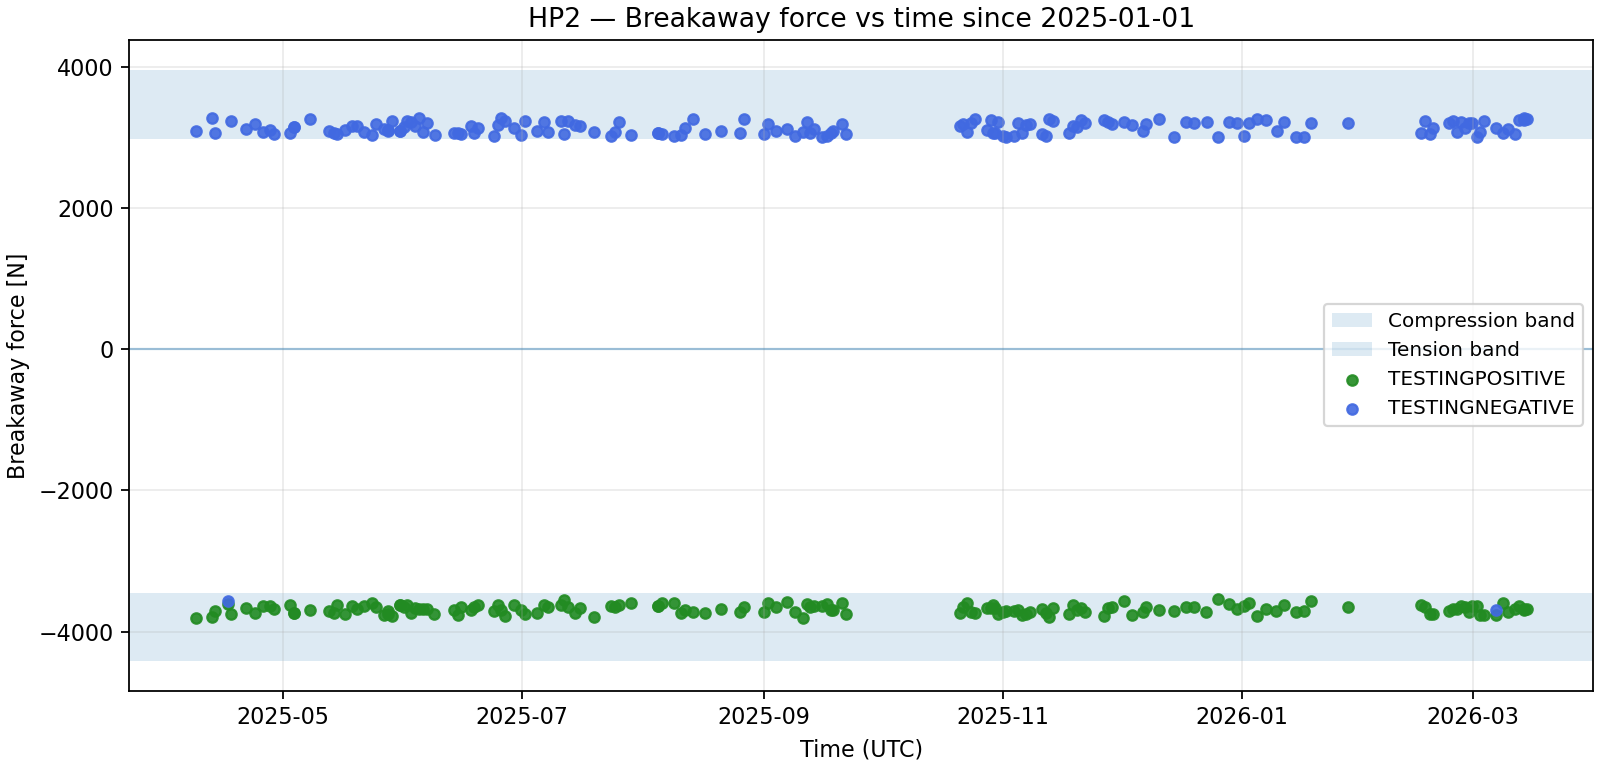
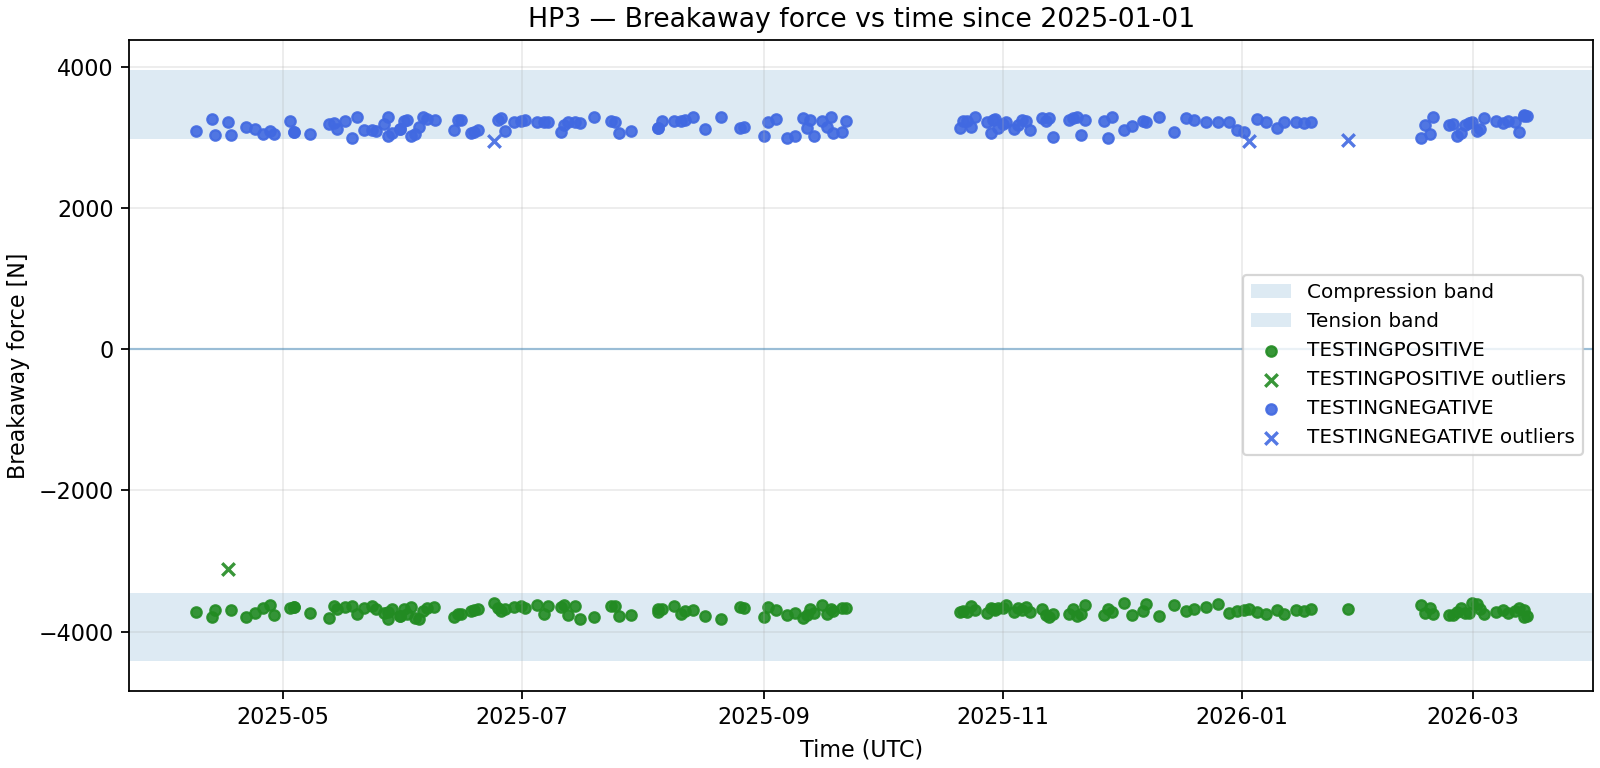
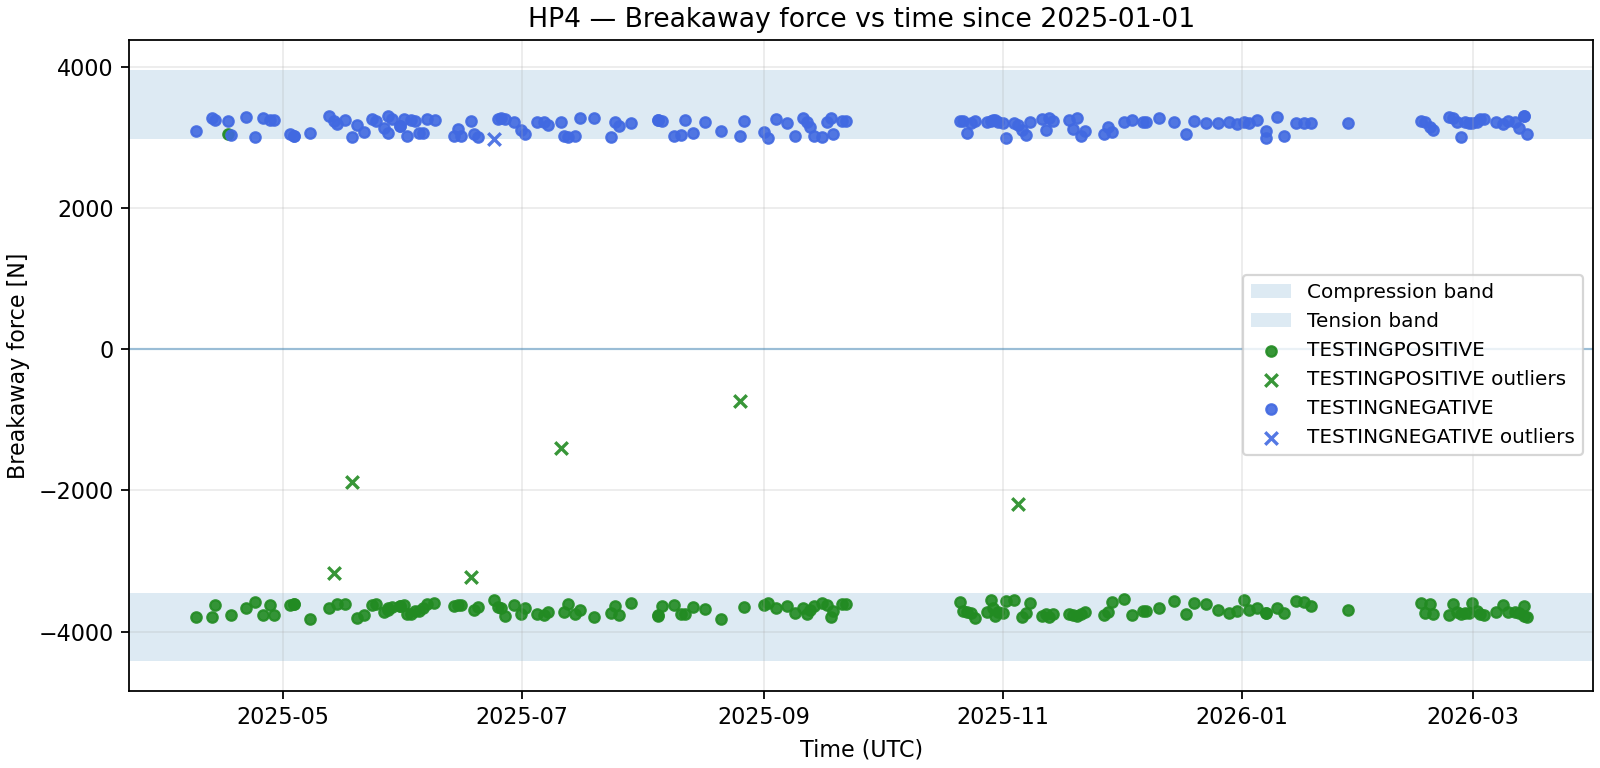
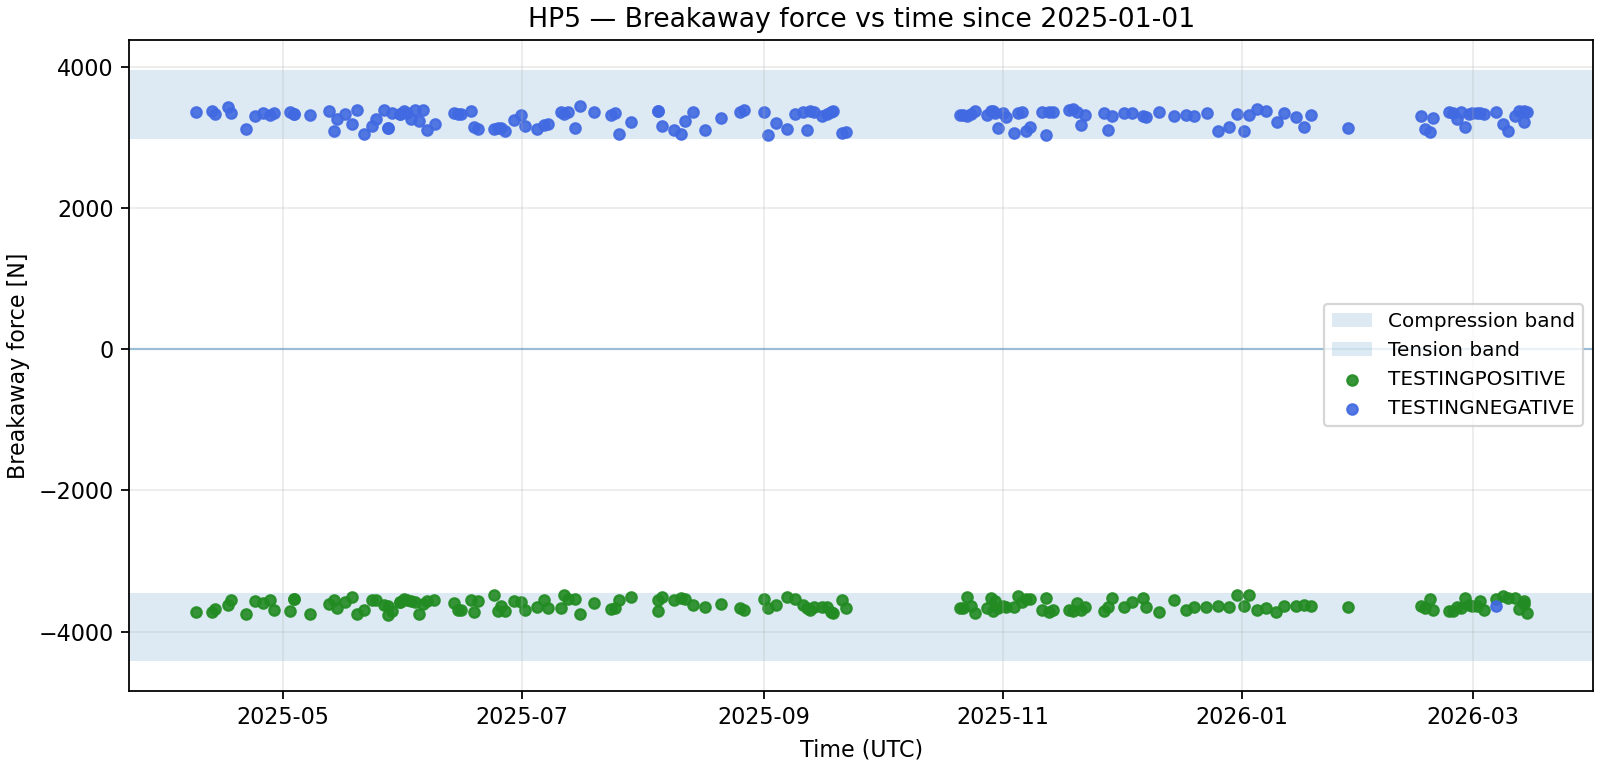
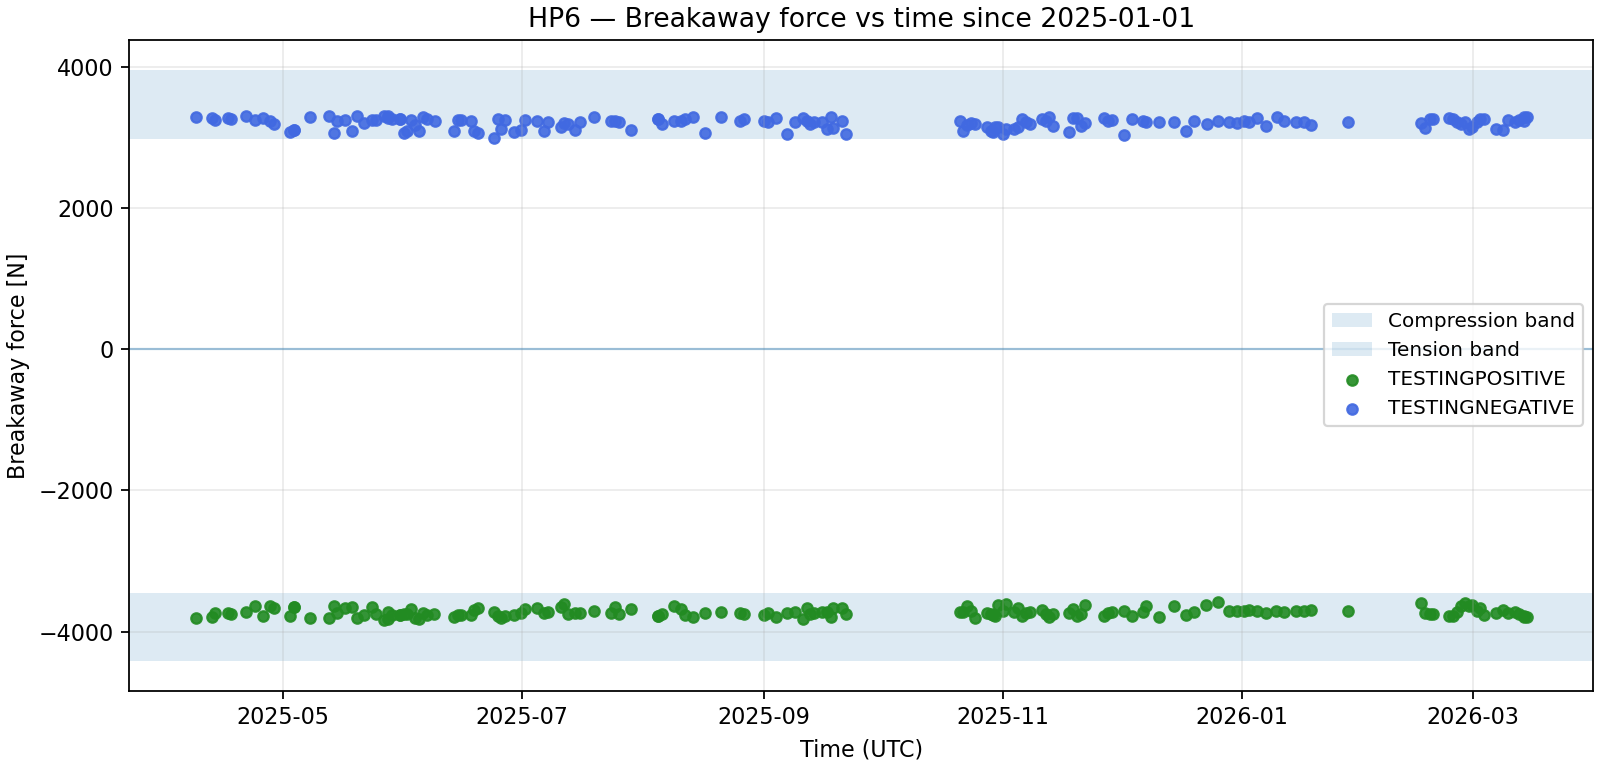
Fig. 23 Breakaway Force vs. Time: Green circles represent positive state points (tension band), and green crosses indicate outliers located between the compression and tension bands. Blue circles represent negative state points (compression band), with blue crosses as outliers.#
When comparing the figures, the breakaway time plots show significantly fewer outliers. HP4 is the exception, showing six outliers, the highest among all units, primarily in the positive testing state.
Regarding stiffness, the overall trend for both states has become more linear for most HPs. However, HP3 and HP4 exhibit the most irregular trends in both tension and compression, while HP1 consistently shows the lowest stiffness trend.
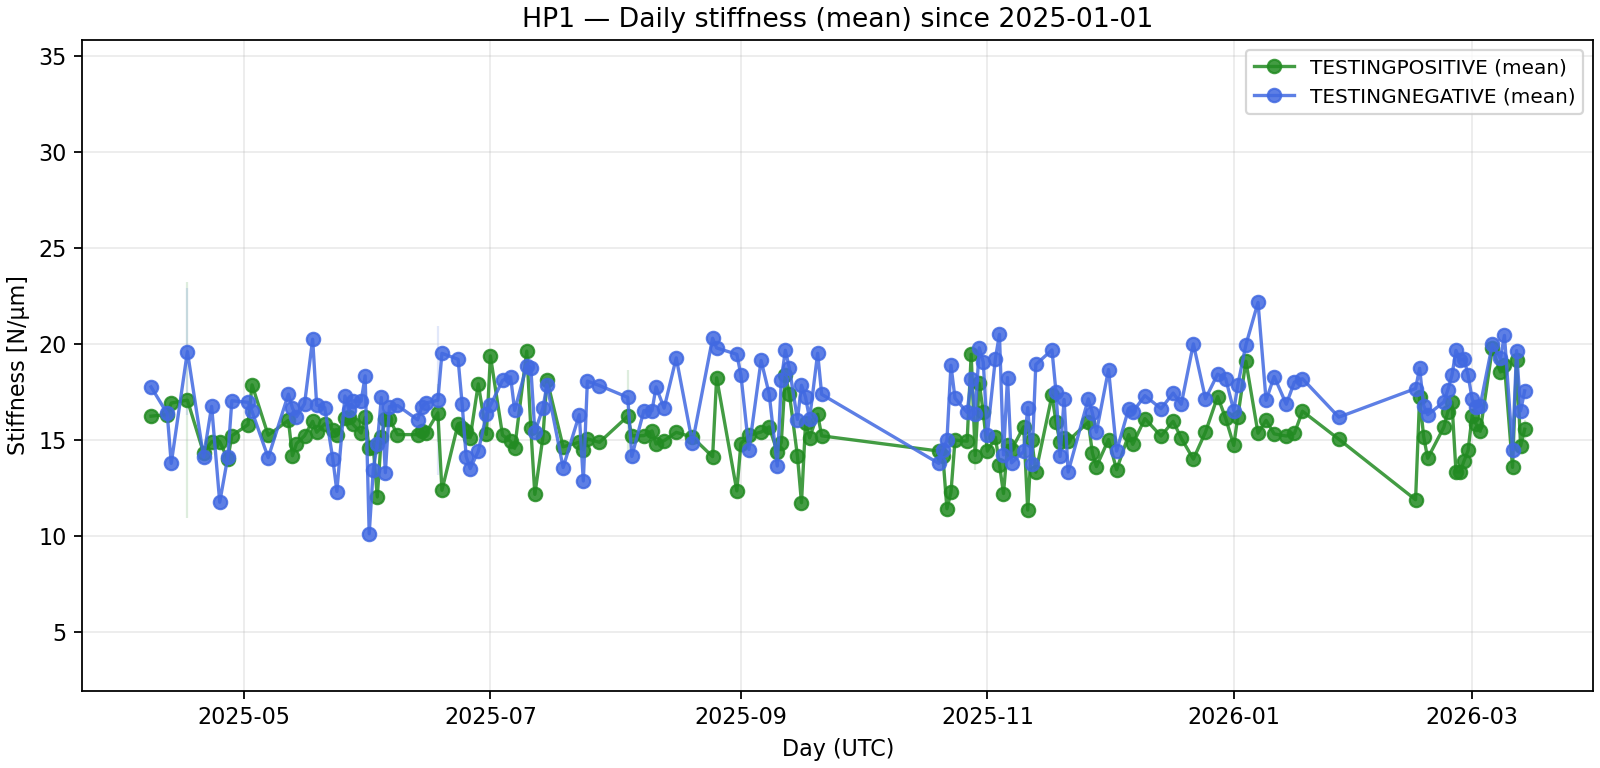
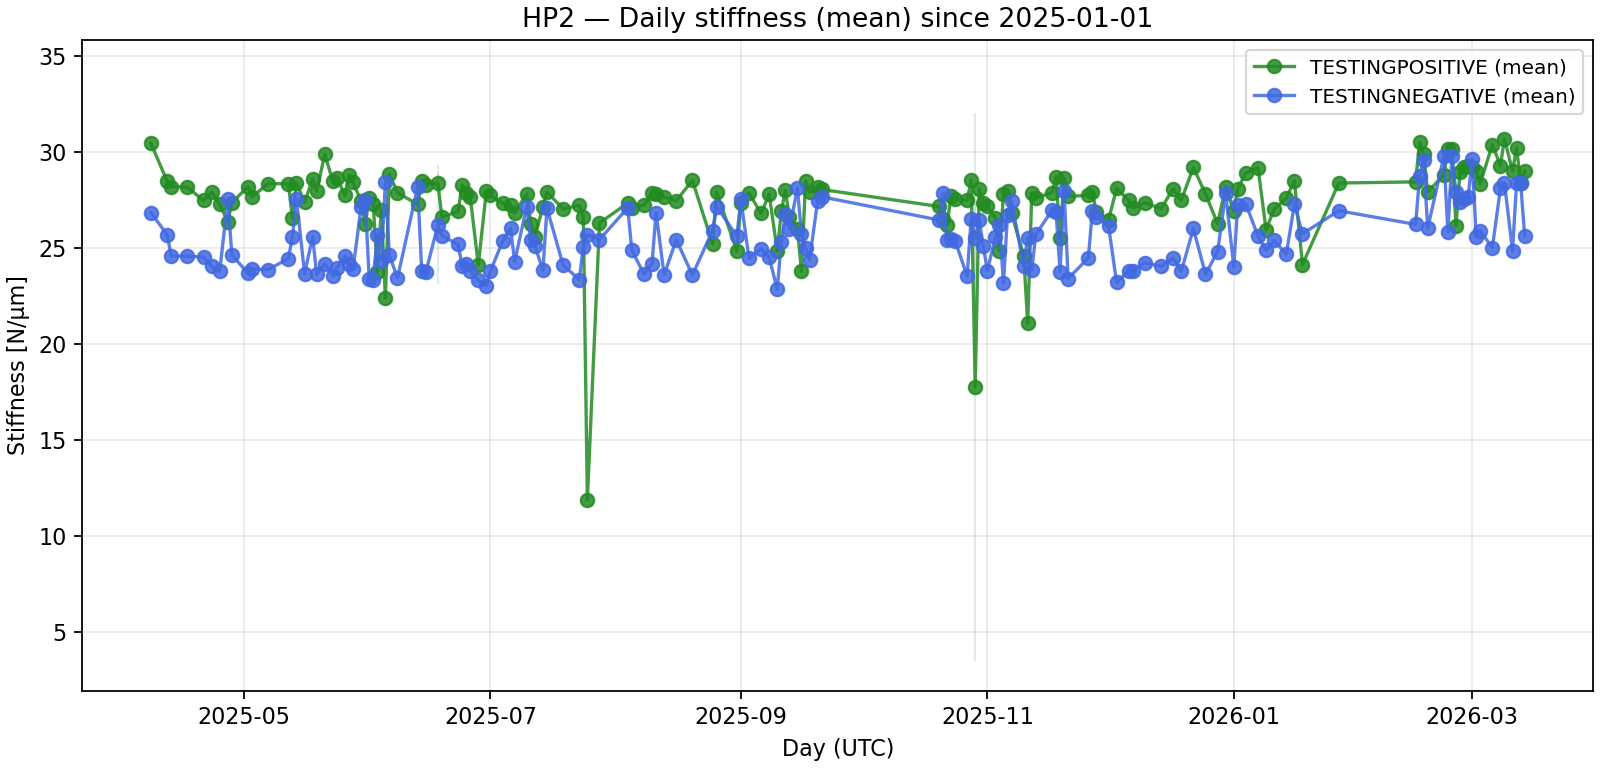
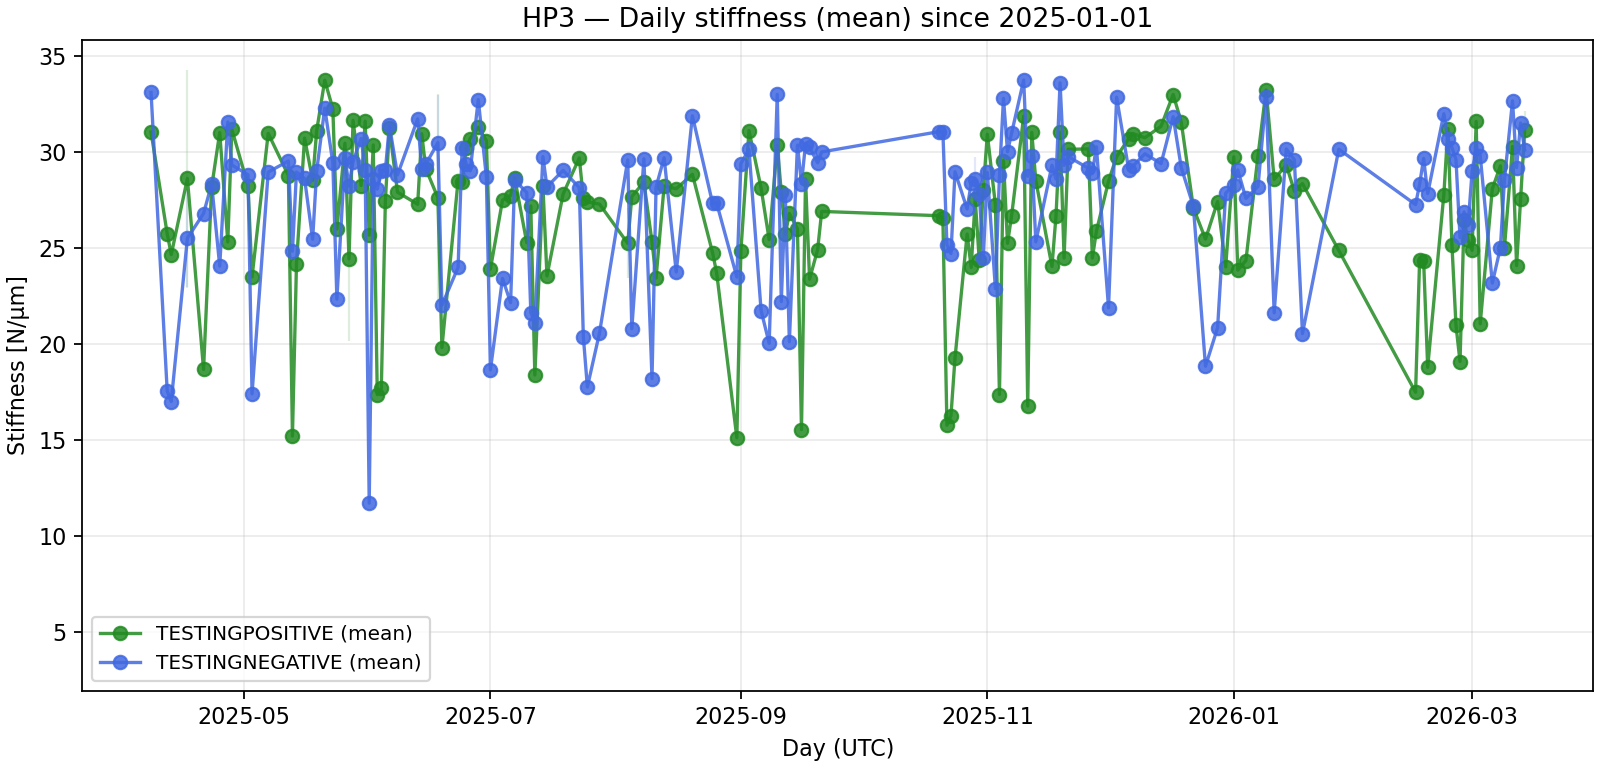
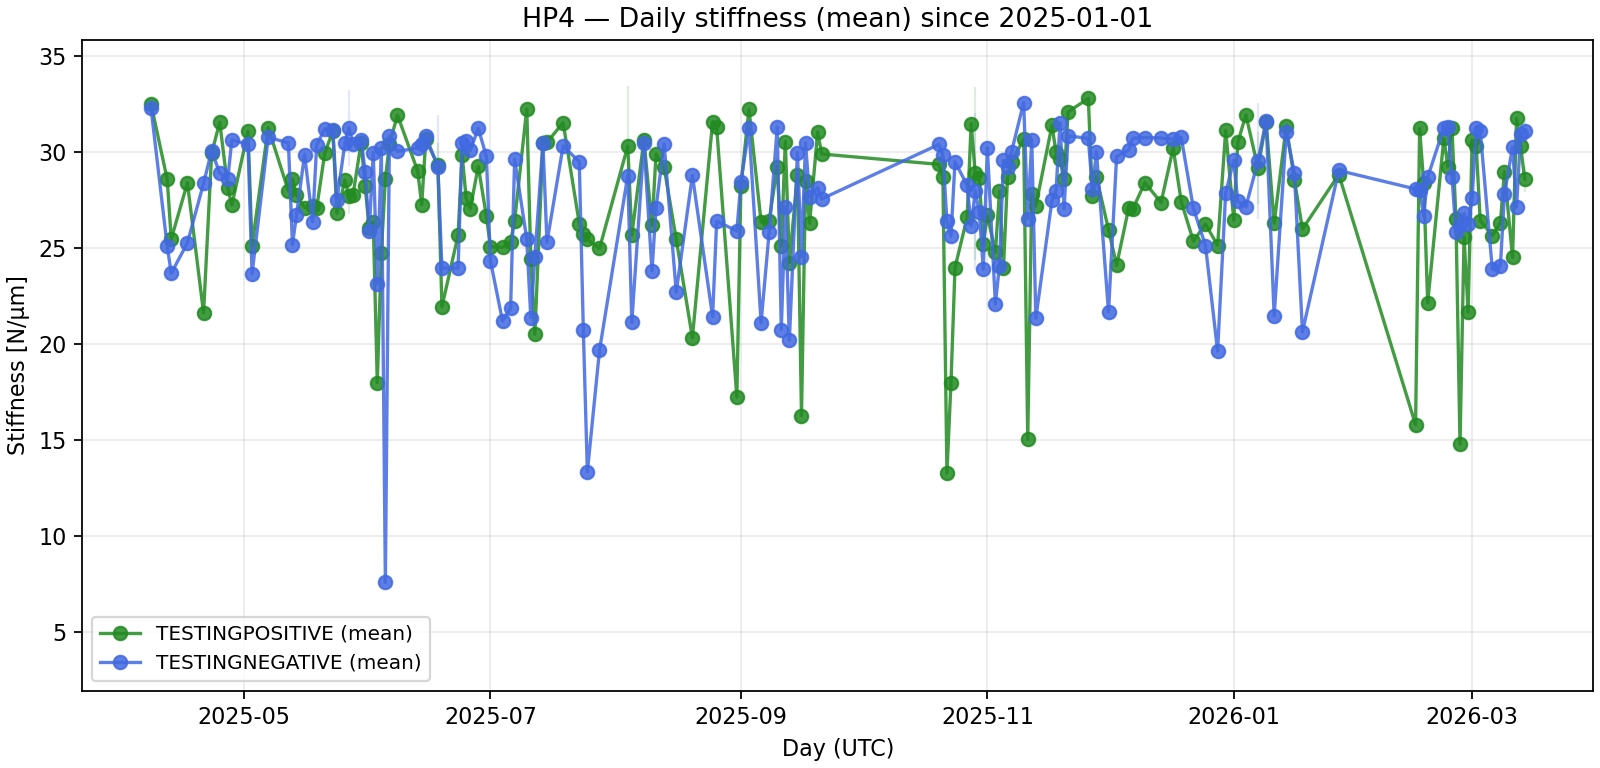
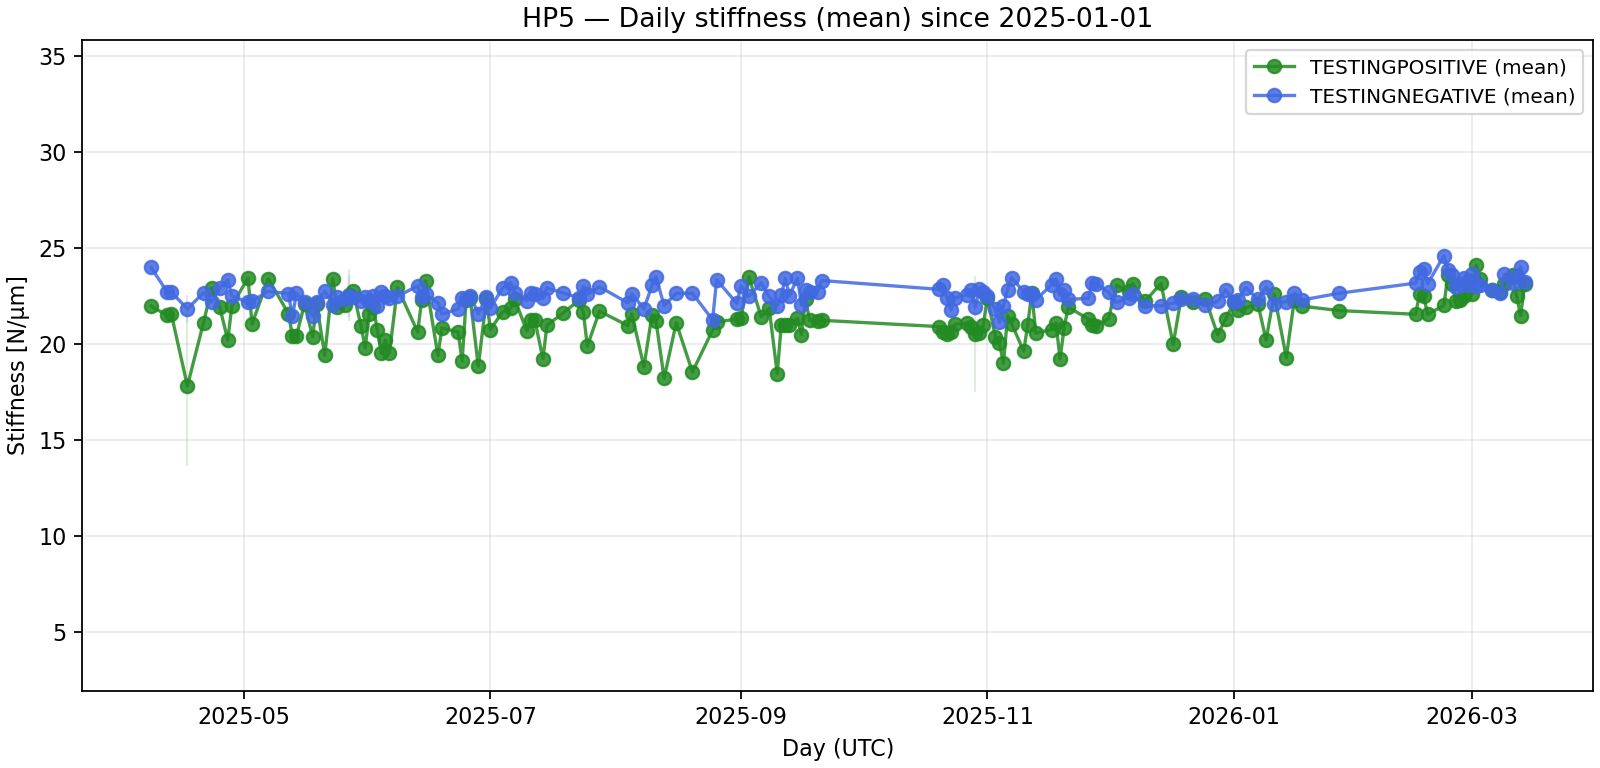
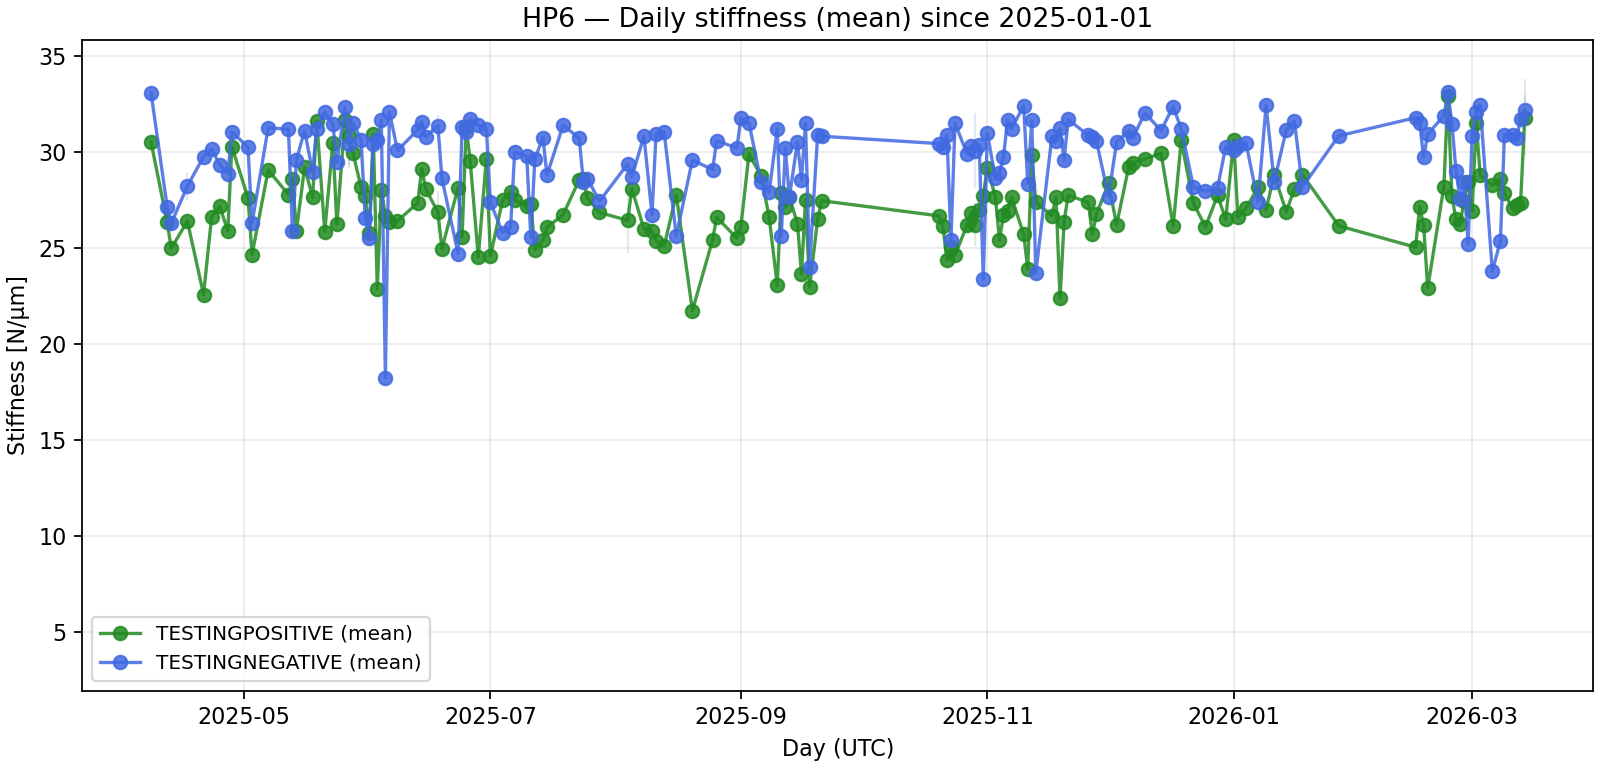
Fig. 24 Stiffness vs. Time: Green and blue points represent the daily mean stiffness values for the positive (tension) and negative (compression) states, respectively. These figures clearly demonstrate the unusual behavior of HP3 and HP4, which exhibit significantly higher fluctuations compared to the other hardpoints.#
Finally, if standar deviation is calculated, we can see, that HP3 and HP4 have the highest values.
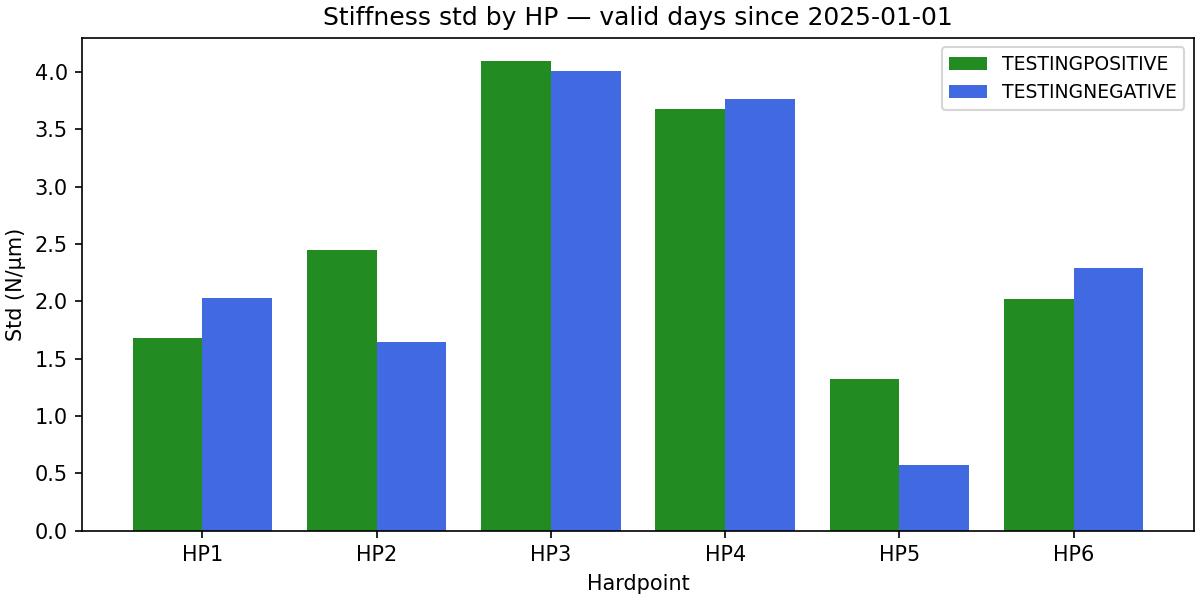
Fig. 25 Standar deviation for each hp since 2025.#
HP |
𝜎 Testing Negative |
𝜎 Testing Positive |
|---|---|---|
1 |
2.032 |
1.677 |
2 |
1.646 |
2.445 |
3 |
4.012 |
4.093 |
4 |
3.764 |
3.673 |
5 |
0.573 |
1.321 |
6 |
2.288 |
2.024 |
Summary#
The historical analysis of the M1M3 breakaway hardpoint tests leads to the following findings:
Data Representativeness: Data collected prior to 2025 is considered non-representative. From 2025 onwards, the data is reliable and should be used for behavioral modeling.
Angular Sensitivity (HP2 & HP5): HP2 and HP5 exhibit higher instability at elevation angles below 60°. While this behavior was clearly visible in pre-2025 datasets, there is currently insufficient data in the recent logs to confirm if this trend persists.
Anomalous Fluctuations (HP3 & HP4): Unexpectedly, HP3 and HP4 show significantly higher dispersion and fluctuations compared to the other hardpoints. It is necessary to analyze this behavior in detail and incorporate additional parameters that may be affecting the system’s performance.
References#
Felipe Daruich, Douglas Neill, Michael Warner, and others. LSST M1M3 active mirror support system optimized to accommodate rapid telescope motions. In Heather K. Marshall and Jason Spyromilio, editors, Ground-based and Airborne Telescopes VII, volume 10700 of Proc. SPIE, 107003G. July 2018. doi:10.1117/12.2313724.